
Background
For the past month or so I’ve been investigating the claim that the phylogenetic signal is evidence that a dataset shares common descent.
Supposedly, the phylogenetic signal is one of, if not the, strongest pieces of evidence for common descent. It is one of the first of the 29+ evidences for evolution offered over at Talk Origins (TO).
Quoting from the article:
The degree to which a given phylogeny displays a unique, well-supported, objective nested hierarchy can be rigorously quantified. Several different statistical tests have been developed for determining whether a phylogeny has a subjective or objective nested hierarchy, or whether a given nested hierarchy could have been generated by a chance process instead of a genealogical process (Swofford 1996, p. 504). These tests measure the degree of “cladistic hierarchical structure” (also known as the “phylogenetic signal”) in a phylogeny, and phylogenies based upon true genealogical processes give high values of hierarchical structure, whereas subjective phylogenies that have only apparent hierarchical structure (like a phylogeny of cars, for example) give low values (Archie 1989; Faith and Cranston 1991; Farris 1989; Felsenstein 1985; Hillis 1991; Hillis and Huelsenbeck 1992; Huelsenbeck et al. 2001; Klassen et al. 1991).
http://www.talkorigins.org/faqs/comdesc/section1.html#nested_hierarchy
I’ve been skeptical of this claim. A tree is just one kind of directed acyclic graph (DAG), and my hunch is many kinds of DAGs will also score highly on metrics for phylogenetic signal. I picked one metric, the consistency index (CI), which according to Klassen 1991 is the most widely used metric. It also is the featured metric in the above TO article. Plus, it is very simple to calculate. So, I’ve focused my efforts on the CI metric.
Result
What I have found is that my hunch is correct. It is simple to create a DAG that scores highly in CI, well within the range of published CI scores for real datasets.
Consequently, it is incorrect to say the phylogenetic signal is strong evidence for evolution. In particular, this claim is provably false (as I have proven here):
Phylogenies based upon true genealogical processes give high values of hierarchical structure, whereas subjective phylogenies that have only apparent hierarchical structure give low values.
http://www.talkorigins.org/faqs/comdesc/section1.html#nested_hierarchy
How have I proven it false? I generate DNA sequences from directed acyclic graphs, and the trees derived from these sequences using well established methods produce CI scores well within published ranges. Here are two such experiments plotted on the chart from Klassen 1991:
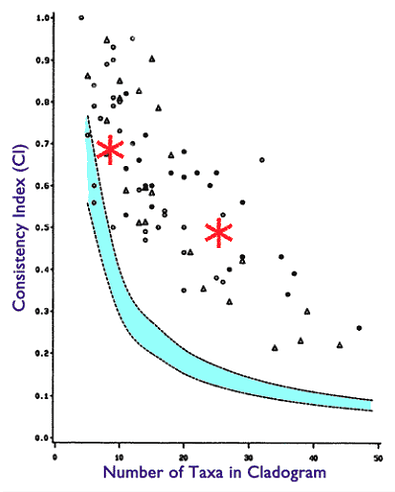
This is a phylogeny with very high value of hierarchical structure not generated from a true genealogical process.
Methods
To reproduce my results you can run the DAG dataset generator here: https://repl.it/@EricHolloway/Phylogenetic-Signal-Fallacy-Nucleotide-Level
Take the generated DNA sequences, which are in FASTA format, and paste them into the ClustalW online tool.
Take the results of the ClustalW tool, and use the PAUP software to generate trees and measure CI scores. You’ll need to fiddle with the NEX file format, so to save you the trouble, I’ve included an already created NEX file that I’ve generated from the aforementioned process, which you can pop into PAUP.
Once you load a NEX file into PAUP, here are the steps to generate trees, and then measure CI.
- Press “Generate Trees” in the “Trees” menu.
- Press the “OK” button.
- Press “Describe Trees” in the “Trees” menu.
- Press the “Describe” button.
- You will see something like the following:
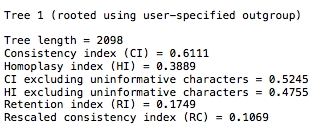
You will find the 27 taxa in the file will generate CI scores in the range of 0.48-0.53. If you look at the Klassen 1991 chart, you will see this is well within published scores for that number of taxa.
Conclusion
So, what is my takeaway from this?
Basically, highly statistically significant CI scores do not indicate common descent. They can just as easily be generated by a DAG. Therefore, we cannot infer common descent from high CI.
Furthermore, insofar as CI is representative of the state of phylogenetic signal measurement, my result undermines the more general claim that phylogenetic signal indicates common descent.
As such, the Talk Origin’s claim that the nested hierarchy of species is well attested by the data is highly questionable if not outright false, and should be retracted as evidence for evolution until such time as a much more rigorous analysis with DAG eliminating controls is established.
Addendum
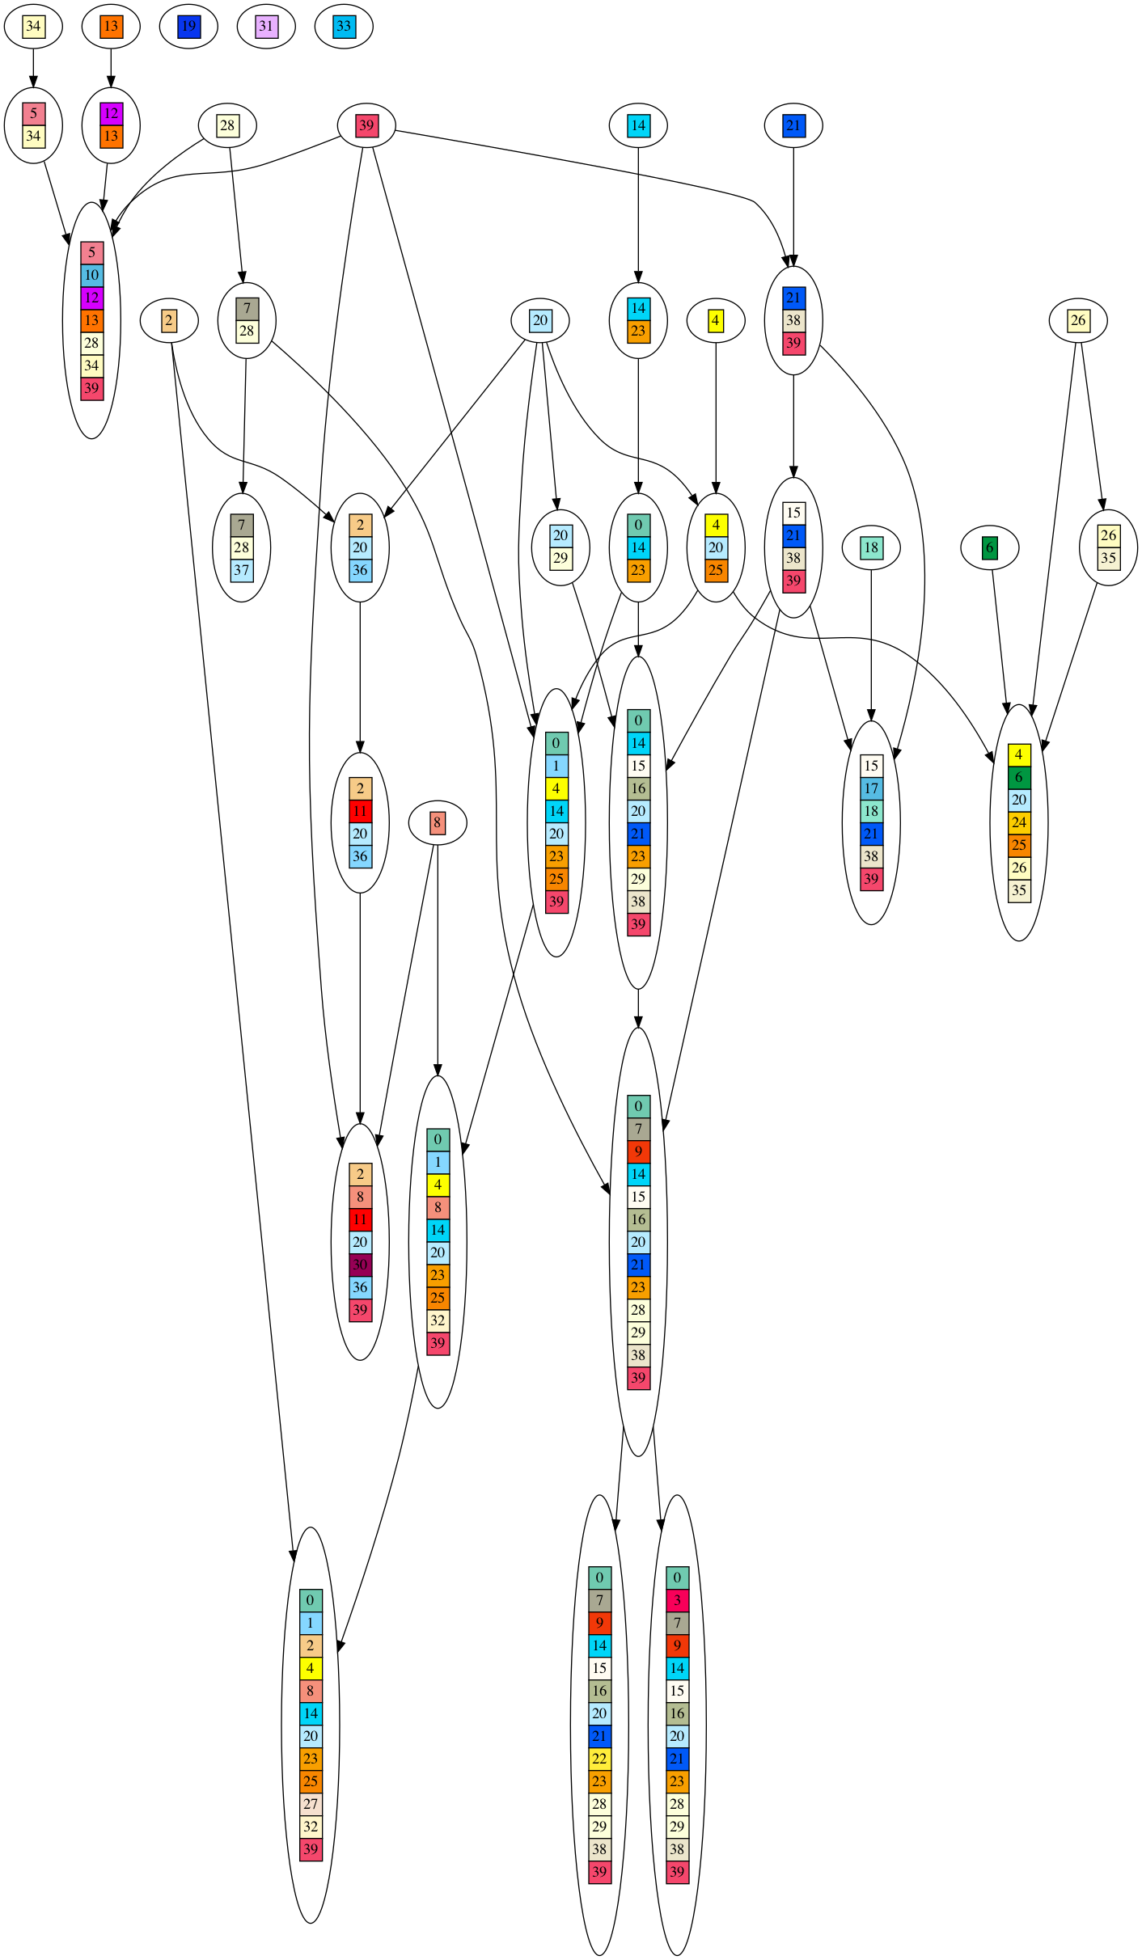
To visually illustrate what I mean by a DAG generating the DNA sequences, here is a graph of one such DAG. Each colored/numbered box represents a gene, which is replaced by a unique, randomly generated (uniform over ‘GATC’) DNA sequence of 20-30 letters long in post processing. Arrows indicate when ‘ancestor’ gene sets are combined into larger gene sets. If you look closely, you will see each gene set contains the union of all incoming gene sets, plus one new gene. As you can see, this looks nothing at all like an evolutionary process, yet it produces very high phylogenetic signal as measured by the consistency index (CI) metric.
The article states:
> Phylogenies based upon true genealogical processes give high values of hierarchical structure, whereas subjective phylogenies that have only apparent hierarchical structure give low values.
It then states:
> One widely used measure of cladistic hierarchical structure is the consistency index (CI).
I then create a subjective phylogeny from the output of a non genealogical process, which has a high CI value, thus proving the above false.
Now, if as some here want to say the DAG is also a genealogical process, then I have no disagreement. If the high CI values published by Klassen are just as indicative of a DAG as of a traditional treelike evolutionary process, then I have no qualms with the nested clades argument, since nested clade metrics are apparently just as consistent with Dr. Ewert’s dependency graph of life as they are with the treelike evolutionary process we are all taught in school. In which case, it looks like we all agree that ‘evolution’ can look just as much like a DAG as a tree, and there is nothing further to argue.
The entire reason I undertook this project in the first place is because multiple forum commentators have presented the nested clade Talk Origins article, and particularly the 70 CI value chart from Klassen 1991, as counter evidence to Dr. Ewert’s result. However, it now appears it is not counter evidence, and is entirely consistent with Dr. Ewert’s result. As such, my original hypothesis has been verified, and I am satisfied, and have nothing further to say. Hopefully this also answers the questions about the theoretical and psychological motivation of my project. If I am wrong in my take here, please explain why.
One common question I saw pop up is whether my code is generating just the leaves, or also the ancestors in the FASTA output at the end. It is just the leaves, e.g. the 11 items with no descendents you see in the DAG picture above.
Another common question is asking what settings I used in ClustalW and PAUP. In ClustalW I use the defaults when you load the webpage, and paste verbatim whatever FASTA my script generates. In PAUP, to do the bootstrap, I first generated the 100 random trees. Then, while the bootstrap ran it asked me if I wanted to keep increasing the number of trees. When I said ‘no’ to this the algorithm would keep running with no resolution. So, I said ‘yes’ and the algorithm ran to completion and generated the tree I posted. Otherwise, I just use the defaults whenever PAUP presents me with an option. Hopefully that clarifies all questions along these lines.
Where?
Just not true. The author, I believe, was confused. CI is intended as a measure of homoplasy, or implied homoplasy.
But CI is irrelevant in analyzing your data, as all the change over the tree arises from Clustal’s poor alignment. A proper alignment would show an undefined CI, as all characters would be invariant.
I don’t think those random trees would actually be preserved during the bootstrap; they would be discarded from memory as soon as you started, and a new tree would be built to begin each replicate, then swapped to produce more trees up to whatever limit you set.
I hope I have explained why. The CI you get is an artifact, and there’s no way to compare it to a real data CI, so your analysis shows nothing.
I have another question: what is sequence 0, how did you construct it, and why is it in your data matrix?
I’m not as familiar with Eric’s behavior as some would be. Has he taken his toys, declared victory, and gone home, or is he just slow to respond in general?
He will shortly write at Mind Matters that no biologist has been able to show that there is any evidence that there is a tree of life. He did this several times for the arguments of Dembski / Marks / Ewert. After they had been rather thoroughly demolished, he would write that no one had been able to show him an argument that refuted them in any way, that all those objecting to these arguments were basing themselves only on ad hominem arguments.
Yes.
Slow to respond. I am currently improving my simulation based on your feedback and others, and will post once I have something to show, so as to not waste your time or mine.
You had one more question about the source of taxon 0. It is randomly generated with uniform distribution over GATC. I was told by a participant in another forum that everyone who does this sort of analysis always has a taxon in an outgroup for some reason, so I created a random taxon for my outgroup. It only made a slight difference in improving the CI score.
Let me remind you that your CI score is entirely artifactual, and the fact that your file gives any tree a CI at all is entirely due to misalignment of the sequences. If properly aligned, your data set would show only invariant characters, so there could be no CI.
What are you doing to improve your algorithm? Using DNA characters, when the characters themselves are invariant, adds no information. What you actually have should be stated as a presence/absence matrix of genes. That might get you somewhere.
I don’t see a way of fixing your other problem: that your matrix is formed by common descent of a sort, though with reticulation and with a very odd sort of genetics.
This might be a good time to point out that the study to which you’re comparing your artifactual results used binary characters, not four-state characters, and this too would be expected to have an influence on CI.
I am creating DNA sequences that look like real DNA sequences without any gaps. Evograd at the Biologos forum told me this is what was wrong with my approach. I’m still getting decent CI, rescaled CI, and well supported trees, with zero gaps in the alignment. I’ll post results probably on the weekend.
If you want to test it out yourself, you can run the code here.
You’ll want to run it until you generate a dataset with about 12 taxa. Then, run the dna.nex file through PAUP, and compare it to a real world dataset, such as this primate dataset: https://paup.phylosolutions.com/tutorials/quick-start/
It also creates a dot file with the graph structure, which you can visualize using graphviz, such as this online visualizer: https://dreampuf.github.io/GraphvizOnline/
Just paste the file contents into the visualizer, and the graph will appear on the right. (note, any singleton nodes you see are excluded from the final dataset)
This is what I did at first, and achieved very high CI scores. So, forum members at Biologos stated I needed to perform my analysis at the nucleotide level, which is what I am now doing.
Hopefully people can agree on what it is I am doing wrong 🙂
I do not know what you mean by that, since gaps come about only from alignment. How are you aligning these gapless sequences?
Your description of your algorithm tells me nothing, and the python code isn’t even commented. Please explain in sufficient detail what your code does.
Then you shouldn’t compare it with a study that used binary characters.
The are generated pre-aligned, although I can throw in a little wiggle if it’s important to run an aligner. I can also add artificial gaps to mimic aligning. Basically, any sort of cosmetic adjustment is possible to make the sequences more pleasing to the eye, and it doesn’t seem to change the CI, RC, branch justification, etc. and I can routinely generate datasets that produce comparable values to real world datasets.
Next chance I have a good block of time I’ll write up the simulator in more detail.
One piece of advice I can use is if you have a source of real world datasets to compare my results.
I didn’t think I should do the nucleotide analysis in the first place, since my original experiment was binary, and achieved well above published CI values, thus proving my point.
But, now that I am doing the nucleotide analysis, I need some datasets for comparison, if you have any links handy.
That’s good, because I have no idea what you’re doing.
Knock yourself out:
https://www.treebase.org/treebase-web/home.html;jsessionid=549CC5D0F09CD12BD8F3004B9C165197
EricMH,
Incidentally, I sincerely doubt that you have the slightest idea what you’re doing. You have yet to demonstrate any comprehension of what you’ve done so far.
Sometimes very slow.
When/where will you be publishing?
I’ll write another article here.
It’s not too inspiring when someone presents a “work” that shows astounding incompetence, ignorance and misunderstanding, yet gives it a “triumphant” title. As if people in phylogenetics hadn’t tested things in much more conscientious ways than Eric with his equivocating toys.
Eric: if something looks too easy of a disemboweling of evolution, it’s very likely you misunderstood quite a bit and you did a lot of things wrong. Thus, you should proceed with a lot more caution and avoid triumphant tones.
You’re not as dumb as you look.
Someone else’s eyeball alignment?
So if I think something is designed, by eyeballing it, and colewd thinks something is designed, by eyeballing it, and John Harshman, using his patented method, thinks it is not designed, who wins?
I can tell you who loses. Science.
All CI scores are entirely artifactual.
Oh, shut up. Does science win when you send money to the Discovery Institute?
That’s an easy one. John wins. The rest of you are much like Erik, gleefully finding “holes” that are merely your misunderstanding rather then anything of actual significance.
If you were on the outside of all of this and you, colewd and John made a claim about an area in John’s expertises who would be most likely to give the correct answer?
Mung, who is never brave enough to state what he actually thinks and is some sort of computer programmer without any expertise in biology.
colewd, who thinks that atoms are designed and there is evidence to prove it.
John, with a track record of peer reviewed publications
All other things being equal who would you bet on to have the right answer?
Science loses when people like you try to pretend there are two sides, when in fact there is only ignorance vs knowledge.
Is that what you think this is about? Detecting design? In fact you are quite accurate.
Design detection seems merely to be if someone thinks something is designed. You can ‘eyeball’ something and stake a claim to design.
And you are quite right, if you make such a claim and someone else makes the opposite claim then as you are all ‘eyeballing’ it nobody can definitely state if it was designed or not.
And that’s the state ID finds itself in. Design is ‘eyeballed’ in and as it’s done on a gut feel level it cannot ever be disconfirmed. How do you disprove someone’s opinion?
So, Mung, nobody wins because nobody is playing your stupid game. Nobody is attempting to prove that things were not designed. There’s no need.
Whereas your side has a desperate need to demonstrate design. And all you have so far is ‘eyeballing’.
Bacterial flagellum looks complex – must be designed.
Atoms – designed.
etc etc.
Aye, there’s a bit of a switcheroo going on when one flips from ‘eyeball alignment’ of nucleotide strings to ‘eyeball design detection’.
I don’t know why one would have more faith in a program than visual alignment, in the first case. It’s as good or bad as its design. The fact that two people can run the same program on the same sequences and get the same result is a bit ‘well, duh’. Then how does one test whether the computerised alignment is any good? Any ideas? This is a bit of a clunker of an argument from Mung, to regard ‘a program’ as science and anything non-algorithmic as not.
If 2 people disagreed on a visual alignment, they could each write a program … 🤔
Aligning a sequence of nucleotides or amino acids, and “thinking something is designed by eyeballing it” isn’t the same thing.
Telling whether something is in alignment or not really can be done by looking at it. You can even get software that helps you do it by scoring your alignment by some objective criterion(it will output some score that adjusts up and down as you move pieces of sequences back and forth, or has some other similar way to show how well different stretches of the alignment is aligned).
Notice the bottom row, the grey bars, below the alignment.
This is the problem. I asked quite a lot over at the Biologos forum before running these experiments, and no one could offer a test like this. From what I can tell looking at the literature, and asking people on the Biologos forum, no one seems to have considered its possible a DAG describes the data better than a tree model. All they consider as an alternate hypothesis is a very simplistic random model.
Now, if you know of such research that considers a DAG as an alternate hypothesis to a tree, please direct me to it. That would be fantastic, and save me doing all this work.
Otherwise, I have to say my title is accurate, not triumphant. The inference of a common descent tree model from these various metrics is not a well founded inference, until someone has done an experiment like mine.
I’ve updated the code, so now it creates a much easier to understand graph, and the DNA sequences are gapped like I see in real world datasets. You may have to run the simulation a couple times to find a high scoring graph, but they occur pretty frequently.
As mentioned before, you can visualize the graph.dot file with an online visualizer like this: https://dreampuf.github.io/GraphvizOnline/
To analyze the DNA sequences, use the PAUP software:
Sorry, still haven’t found the time to write it all up.
One problem with that is that a tree is a DAG. What you mean is a DAG with, apparently, the structure of Ewert’s graph. But that graph shows a set of binary presence/absence characters; it can’t be adapted to sequences, so your quest here is just nonsensical. Stick with the presence/absence. Further, the parts of that graph aren’t taxa but sets of genes with identical taxonomic distributions. Your process might produce taxa that fit the graph, but the graph itself doesn’t do that, and the process you have instantiated doesn’t follow Ewert’s graph. It also has features of a phylogenetic tree and would produce data from a partially phylogenetic process.
The problem is that if you were doing what you claimed to do, correctly, you would produce a data set in which all sites were identical among all species possessing them (and of course gaps in those species without them). This would give you an undefined CI of 0/0 for every tree you tried it on. If you’re getting different results, your process is flawed in some way, though without seeing the data I can’t say exactly how. But it’s still garbage in, garbage out.
Don’t bother writing it up, because the little you’ve said shows that it’s not working as you think.
EricMH,
I’ve looked at your new data set. It doesn’t fix the problems at all. You appear to introduce gaps in the actual sequences. No. Gaps come during the alignment step. Putting gaps in the initial sequences just makes it worse. And you haven’t produced anything resembling an actual alignment. Before you can even begin to program, you must understand what you’re programming, and you show no awareness of how any of this works.
Just to supplement the issues John raises, does the DAG model involve having some primordial sequences that have segments that are each unchanging, with the only changes thereafter being deletion of whole segments, or combining segments? Without any nucleotide substitution at all? Such a model would be rather easily rejected as an explanation of a multiple sequence alignment of almost any part of the genome.
I created gapped sequences to skip the alignment step, and just generate a result which looks like real world datasets, gaps and all. The main point is whatever cosmetic differences there are between the synthetic dataset and real dataset can easily be fixed by modifying the simulation parameters, yet this never affects the simulation’s ability to create a dataset with high CI, RC, well justified branches, etc. all without requiring a strictly tree-like structure.
Think of it not so much as trying to simulate the process itself, but to generate a dataset from a non evolutionary structure that yet looks just like a dataset we believe to have resulted from evolution.
There is no single nucleotide mutation or anything like that. Each module represents a set of randomly selected positions on the genome and randomly selected base. Each colored box in the graph is one such module, and all the colored boxes in a leaf are instantiated in the genome. As you travel in direction of the arrows in the DAG, boxes are only gained, never lost.
For example, module A says position 1 is A and position 5 is G. Module B says position 3 is T and position 9 is T. The leaf consists of modules A and B, so it looks like this, where all positions besides 1, 3, 5 and 10 are randomly filled with a base or gap.
ATT-G–TT
123456789
Nothing else happens to the nucleotides besides that. The remaining unfilled spaces are filled either with a gap or randomly selected base. As Harshman states, there is not alignment phase, the dataset itself is meant to be an alignment. And as I mentioned to him, the point is not to have a realistic process generating the dataset, but merely a non tree structure generating a dataset that scores just as well as real world datasets we assume are the result of a tree-like process.
I’m sorry, but that just doesn’t make any sense at all. How are you aligning these pre-gapped sequences? As I understand it, you’re just combining collections of sequences. But you aren’t, apparently, aligning those sequences now. If you aligned them, that’s where the gaps would come in. Gaps are not just a silly cosmetic phenomenon. They’re necessary to align sequences with different bits missing. What you have is some sequences, some bits of which are aligned, apparently by accident.
I must emphasize that you appear not to understand anything you’re doing, which causes you to produce useless, meaningless results.
Adding ‘gaps’ in that way seems odd. Effectively, it’s just a 5th nucleotide, represented by a ‘-‘, serving no particular purpose other than to address a misunderstood criticism.
If I take sequences of a gene, say malate dehydrogenase, and align the sequences in all mammals in the DNA databases, we can easily see that there have been base substitutions. Therefore no, that alignment does not at all fit this “DAG model”.
I have to say I would also be extremely skeptical that this “DAG” model constitutes a meaningful or useful method for actually designing an organism’s genome, much less a whole clade of them.
It is one thing to claim, apparently based mostly on personal ignorance, that you have found some novel systematic way to generate “phylogenetic signal” using an algorithm you claim is non-genealogical. It is another thing entirely to actually explain how real gene sequences were designed and still ended up looking like they evolved from common ancestors.
Is the claim now that real organism’s genomes look the way they do because they were generated by a “DAG”? Can we take some organism’s genome and DAGify it, to produce a sort of false clade from it consisting of a diversity of seemingly related, but living and functional organisms?
So you believe you can reproduce the observed data by a simulating a completely imaginary ad hoc process? How incredibly useful this ID research turns out to be.
There is actually an option in PAUP to treat a gap as a fifth nucleotide, but the default, which I assume he didn’t change, is to treat it as missing data, in which case it contributes nothing to the analysis.
My understanding of gaps is when we have two sequences which are supposed to line up, but not quite because of indel events. Gaps are inserted where we have to lengthen one sequence so as to line up with the other sequence. They also occur when we have multiple sequence alignment, and we want to only list the elements that most sequences agree upon.
My simulation is consistent with these two sources of gaps.
However, I can modify the simulation to create completely ungapped sequences, and then I can run them through an alignment tool of some sort, or do a visual alignment. As I said, any sort of cosmetic aspect can be added to the simulation, and none seem to affect the main result which is I can generate datasets with high scores in relevant phylogenetic metrics, even though the generating structure is not a tree.
Here is one I generated recently.
https://paste.ubuntu.com/p/hSMYm7gCng/
It has similar characteristics to the primate dataset from the PAUP website.
Same number of taxa, sequences of equivalent length, similar number of gaps.
This is the output of PAUP. You can see most of the branches have decent support.
https://paste.ubuntu.com/p/8dshQMpRRh/
Here are the phylogenetic metric stats, with CI and RC higher than for the primate dataset.
Consistency index (CI) = 0.8352
Homoplasy index (HI) = 0.1648
CI excluding uninformative characters = 0.7178
HI excluding uninformative characters = 0.2822
Retention index (RI) = 0.5103
Rescaled consistency index (RC) = 0.4262
And attached is the graph that generated the dataset. There is hierarchical structure, but also there are multiple distinct trees, and crossover between the trees. (If you are wondering which nodes form the dataset, it is the terminal nodes that only have incoming arrows and no outgoing arrows.)
Yes to the first. No to the second.
You must understand that gaps aren’t cosmetic. What you have done is render your data set unintelligible, which I do not consider a virtue. It’s impossible to tell why you get the result you do. I suspect it’s an artifact of some kind, just like the last iteration was, but you have made such a mess of things that it’s no longer possible to determine the cause of the artifact.
I don’t understand the connection between your graph and the data set. For example, all the “taxa” that contain sequence 81 should have a perfectly aligned (no gaps) sequence 81 somewhere near the start, but I don’t see any such. I don’t even see how you align the sequences supposedly in the process of producing them. Again, I’m thinking that the evidence shows you have no idea what you’re doing.
Would you please
1. give a clear specification of the process you are simulating, and
2. describe how to validate your simulation of it?
Seems like I should do another article outlining exactly what is going on.
Briefly, I construct a random DAG. Then, I trace through each path from root to leaf, where each node adds a module to the leaf. If two paths go through the same node while travelling from root to leaf, the node always adds the same module to the end leaf, and a module only shows up a maximum of once in each leaf. I’ve visualized this process graph, and here’s an example, where each unique color/number box is a unique module (this particular graph gets a bad CI score).
So, what is in a module? Each of those modules lists a set of randomly selected positions in the genome and a randomly selected base for each position.
Each leaf has a collection of modules that have been picked up through the DAG. Looking at the graph I posted before, you can see this aggregation happening by tracing from a root (only outgoing arrows) to a tree (only incoming arrows).
The leaf takes the collection of modules and applies all the positional/base information to a blank genome. Then, any remaining unfilled cells in the genome are randomly filled with one of ‘GATC-‘.
For example, module A says position 1 is A and position 5 is G. Module B says position 3 is T and position 9 is T. Leaf #1 consists of modules A and B, so it looks like this, where all positions besides 1, 3, 5 and 10 are randomly filled with a base or gap.
ATT-G-GTT
123456789
Let’s also add a module C, which says position 3 is G, position 4 is T and position 8 is A. Leaf #2 contains modules A and C, so it looks like this after remaining empty portions are randomly filled.
A-GTG-TA-
123456789
Let’s line up leaf #1 and leaf #2. Since they both contain module A, they line up at position 1 and position 5 (little hard to tell because the font is not monospace).
ATT-G-GTT
A-GTG-TA-
123456789
Hopefully, this is a bit clearer.
Here’s an example of a binary dataset.
https://paste.ubuntu.com/p/bnNj4gtKnk/
Here’s the PAUP bootstrap.
https://paste.ubuntu.com/p/XK5y4RHH3B/
It scores a CI of 0.5 for 15 taxa, which on the Klassen 1991 chart of binary CI results is statistically significant, and on par with published studies.
http://www.talkorigins.org/faqs/comdesc/images/ci.gif
Finally, here is the graph visualization of the DAG that generated the dataset.
This is a senseless modification which has the sole effect of obfuscating what a “module” is by distributing its sequence discontinuously. There’s no way that the resulting file is properly aligned.
EricMH,
You seem not to have understood my request:
So let me elaborate.
When you speak of computational simulation, there’s got to be a physical process that is simulated by the computational process. What you’ve done is to describe, again, the computational process. But that’s only of secondary interest in science. What’s of primary interest is the physical process, and a specification of how you model it. There’s also the question of how you validate the simulation you’ve implemented. Sure, you run a program, and it produces data in the expected format. But that tells you next to nothing as to whether the simulation, as implemented, models the physical process as you intend. There must be, prior to the implementation, a specification how the simulation models the physical process. And there must be subsequent testing to determine (or increase confidence) that the implementation satisfies the specification.
Perhaps I haven’t read closely enough, but I don’t think anyone has a clue as to what physical process you intend to model with your simulation. You’re not simulating anything if you have not identified the simuland prior to writing the code.
Sorry, but that graph can’t possibly go along with that data set. If each character is a “gene”, which is what you should have, there are way too many genes to be accounted for by the graph. Once again you seem to be doing something quite different from what you imagine.
It really is important to impress upon you one thing: you are not competent to do what you want to do here.
You mean to tell us that you decided evolution was false, attempted to analyze a data set with tools you barely grasp the function of, interpreted results you fully don’t grasp the meaning of, brought your half-baked garbage here, were proven wrong several times by multiple intelligent individuals, and then promptly claimed you were correct and declared your intent to bring your “conclusions” to the masses? Shocking. Not at all what I would expect a proponent of ID to do.
I don’t think he has an actual physical process in mind he is modeling. He’s just showing that “phylogenetic signal“ could arise from something other than common descent. That is, since G-d could have put the signal in there, phylogenetic signal does not mean common descent.
It may well be that Eric used the term simulation just to make his data generation sound science-y. But I’d like to see how he goes about justifying his use of the term.
Eric seems to have gone dormant again without ever having addressed the main problems with his “simulation”.
John Harshman,
He’s posted something related at Mind Matters.
Seems the “design signal” has been found and identified. I will await the sweeping away of the old and it’s replacement with, er