
Background
For the past month or so I’ve been investigating the claim that the phylogenetic signal is evidence that a dataset shares common descent.
Supposedly, the phylogenetic signal is one of, if not the, strongest pieces of evidence for common descent. It is one of the first of the 29+ evidences for evolution offered over at Talk Origins (TO).
Quoting from the article:
The degree to which a given phylogeny displays a unique, well-supported, objective nested hierarchy can be rigorously quantified. Several different statistical tests have been developed for determining whether a phylogeny has a subjective or objective nested hierarchy, or whether a given nested hierarchy could have been generated by a chance process instead of a genealogical process (Swofford 1996, p. 504). These tests measure the degree of “cladistic hierarchical structure” (also known as the “phylogenetic signal”) in a phylogeny, and phylogenies based upon true genealogical processes give high values of hierarchical structure, whereas subjective phylogenies that have only apparent hierarchical structure (like a phylogeny of cars, for example) give low values (Archie 1989; Faith and Cranston 1991; Farris 1989; Felsenstein 1985; Hillis 1991; Hillis and Huelsenbeck 1992; Huelsenbeck et al. 2001; Klassen et al. 1991).
http://www.talkorigins.org/faqs/comdesc/section1.html#nested_hierarchy
I’ve been skeptical of this claim. A tree is just one kind of directed acyclic graph (DAG), and my hunch is many kinds of DAGs will also score highly on metrics for phylogenetic signal. I picked one metric, the consistency index (CI), which according to Klassen 1991 is the most widely used metric. It also is the featured metric in the above TO article. Plus, it is very simple to calculate. So, I’ve focused my efforts on the CI metric.
Result
What I have found is that my hunch is correct. It is simple to create a DAG that scores highly in CI, well within the range of published CI scores for real datasets.
Consequently, it is incorrect to say the phylogenetic signal is strong evidence for evolution. In particular, this claim is provably false (as I have proven here):
Phylogenies based upon true genealogical processes give high values of hierarchical structure, whereas subjective phylogenies that have only apparent hierarchical structure give low values.
http://www.talkorigins.org/faqs/comdesc/section1.html#nested_hierarchy
How have I proven it false? I generate DNA sequences from directed acyclic graphs, and the trees derived from these sequences using well established methods produce CI scores well within published ranges. Here are two such experiments plotted on the chart from Klassen 1991:
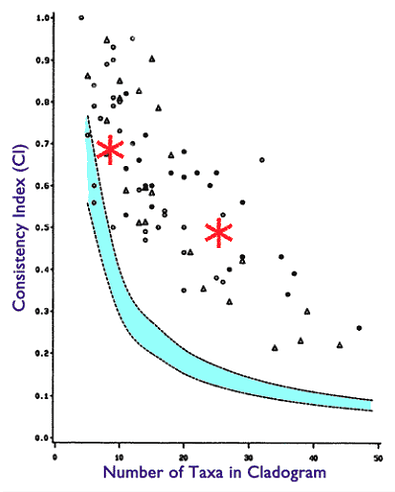
This is a phylogeny with very high value of hierarchical structure not generated from a true genealogical process.
Methods
To reproduce my results you can run the DAG dataset generator here: https://repl.it/@EricHolloway/Phylogenetic-Signal-Fallacy-Nucleotide-Level
Take the generated DNA sequences, which are in FASTA format, and paste them into the ClustalW online tool.
Take the results of the ClustalW tool, and use the PAUP software to generate trees and measure CI scores. You’ll need to fiddle with the NEX file format, so to save you the trouble, I’ve included an already created NEX file that I’ve generated from the aforementioned process, which you can pop into PAUP.
Once you load a NEX file into PAUP, here are the steps to generate trees, and then measure CI.
- Press “Generate Trees” in the “Trees” menu.
- Press the “OK” button.
- Press “Describe Trees” in the “Trees” menu.
- Press the “Describe” button.
- You will see something like the following:
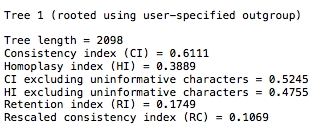
You will find the 27 taxa in the file will generate CI scores in the range of 0.48-0.53. If you look at the Klassen 1991 chart, you will see this is well within published scores for that number of taxa.
Conclusion
So, what is my takeaway from this?
Basically, highly statistically significant CI scores do not indicate common descent. They can just as easily be generated by a DAG. Therefore, we cannot infer common descent from high CI.
Furthermore, insofar as CI is representative of the state of phylogenetic signal measurement, my result undermines the more general claim that phylogenetic signal indicates common descent.
As such, the Talk Origin’s claim that the nested hierarchy of species is well attested by the data is highly questionable if not outright false, and should be retracted as evidence for evolution until such time as a much more rigorous analysis with DAG eliminating controls is established.
Addendum
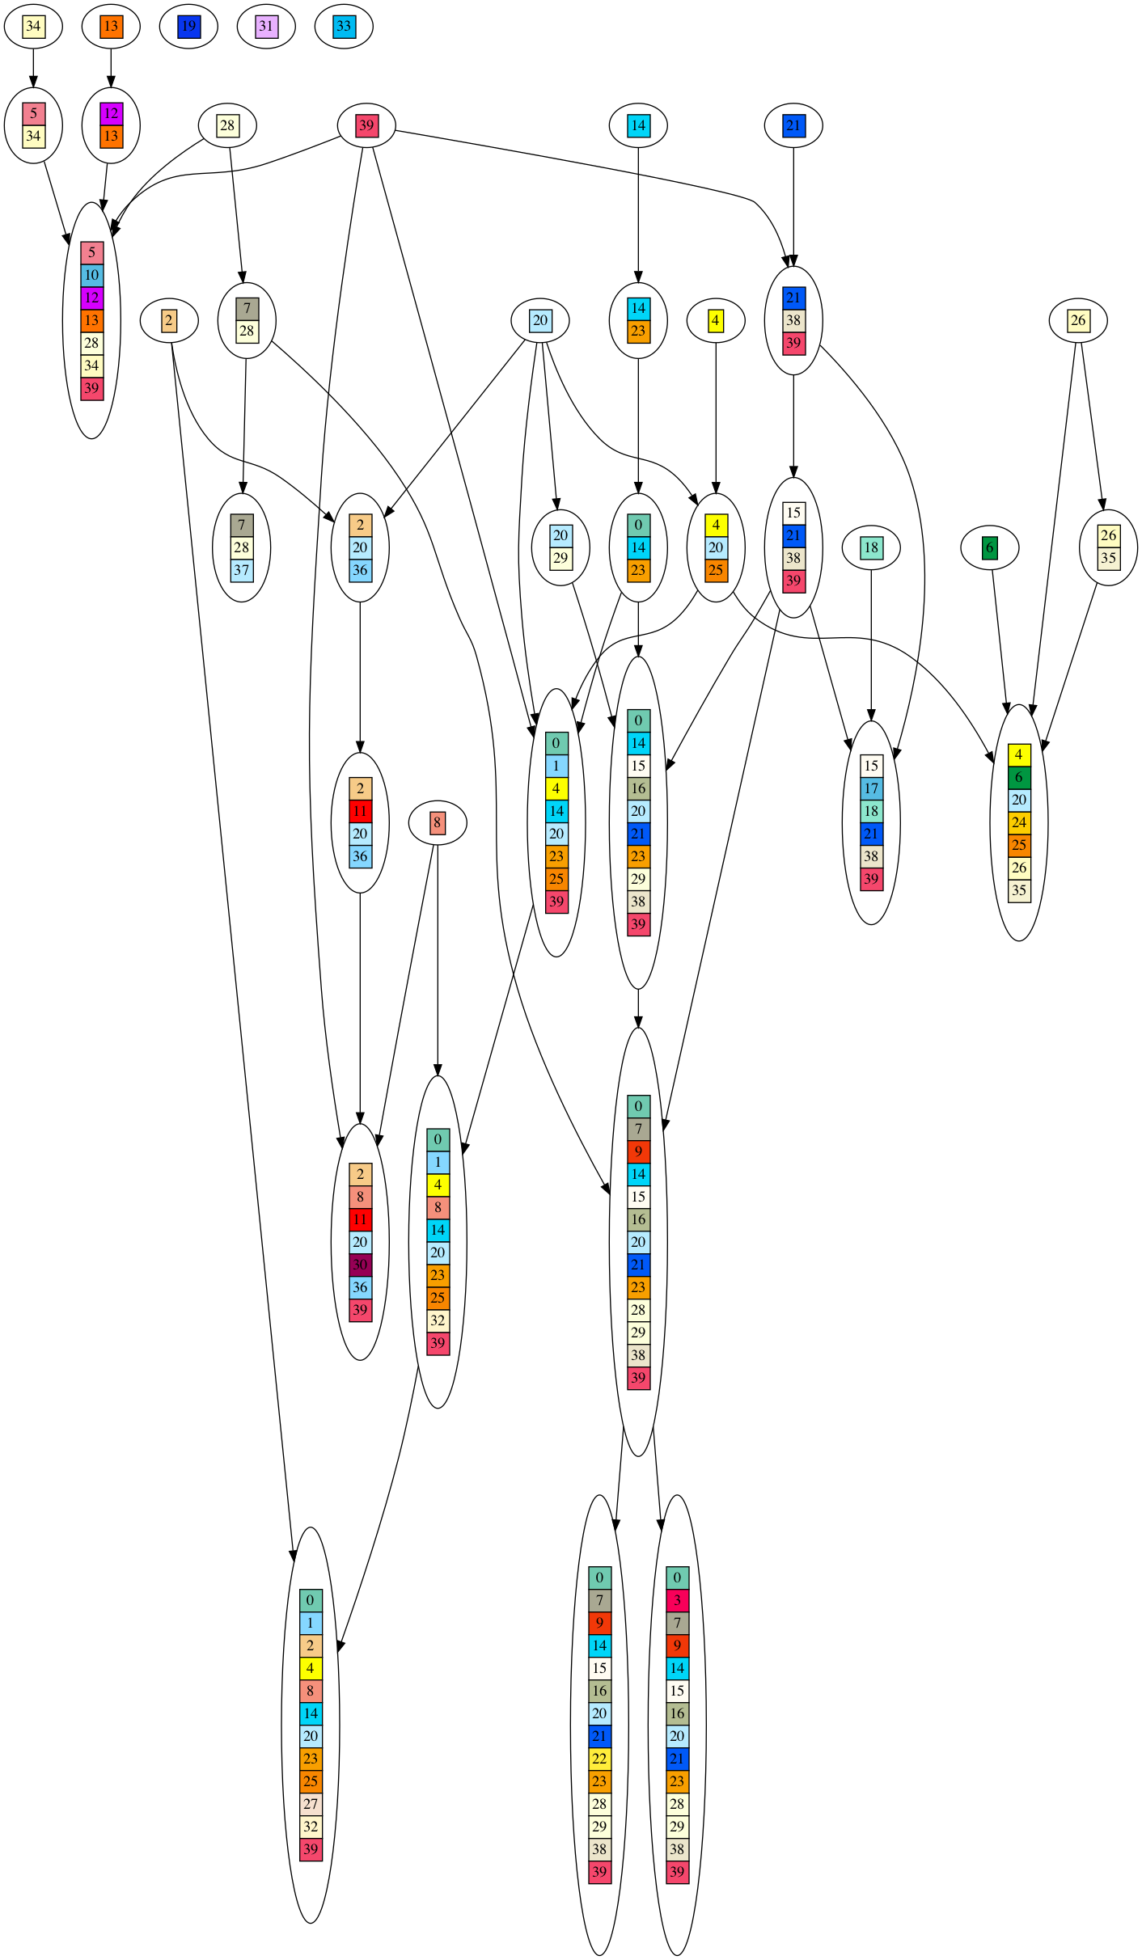
To visually illustrate what I mean by a DAG generating the DNA sequences, here is a graph of one such DAG. Each colored/numbered box represents a gene, which is replaced by a unique, randomly generated (uniform over ‘GATC’) DNA sequence of 20-30 letters long in post processing. Arrows indicate when ‘ancestor’ gene sets are combined into larger gene sets. If you look closely, you will see each gene set contains the union of all incoming gene sets, plus one new gene. As you can see, this looks nothing at all like an evolutionary process, yet it produces very high phylogenetic signal as measured by the consistency index (CI) metric.
Let’s assume that the tens of thousands of scientists who have examined the data and found overwhelming, incontrovertible evidence for nested hierarchy have all somehow been conned into seeing something you find “highly questionable if not outright false.” And further, that you can construct noncyclic graphs you think fit the evidence better. Now what? Besides demonstrating that every expert is and always has been stupid, what about your work is useful in helping direct scientists’ attention in more fruitful research? How would you go about constructing an experiment demonstrating that your preferred graph does a better job, using actual organisms?
While you’re at it, you might provide some hint as to your motivation for rejecting what’s obvious to everyone else. Why do you bother?
I look forward to you submitting this common descent killing evidence to any mainstream scientific journal for publication. Let us know how how fast they laugh you out of the room. On the bright side, BIO-Complexity is always desperate for any hand-waving woo which supports ID-Creationism.
Interesting. Although your claim that your graph “looks nothing at all like an evolutionary process” seems a little off-topic, since it was evidence for common descent that you were trying to refute, and your graph has oodles of common descent.
Also, is this work part of your long-promised effort to “use Ewert’s result to improve bioinformatics algorithms”?
Do you have any examples with real-world sequence data?
Not my field, but it looks to me like mainly a process of HGT with de novo genes. These too are evolutionary processes.
In a ‘real’ dataset, such HGT events would create one well-supported phylogeny, the more usual vertical descent another. This is how HGT events are discovered: by their discordance with the more common vertical genes. It seems that vertical descent has been reduced (but not eliminated) in this model. I’m not really grasping the argument that this is a strike against phylogenetic analysis.
Is it? How about the values of the retention index and the rescaled consistency index?
Also, did PAUP draw a tree? Were its branches well supported?
Corneel,
Based on his brief description, he didn’t actually do a phylogenetic analysis. He just generated a tree (probably many trees, though he doesn’t say) and looked at its parsimony score. There is no suggestion that this tree is the most parsimonious, and no indication that he did any sort of test of support, which would require an actual analysis. CI, RI, etc. are not indices of hierarchical structure.
I can’t figure out, based on the description, what his taxa were or how he aligned the data set. It may be that his scheme does produce data with hierarchical structure. But that could be the result of the inheritance and branching in the model, even though the inheritance is of an odd sort, and the branching involves some reticulation.
Incidentally, when I try to download the NEXUS file, I get a 404 error.
Here’s the file:
#NEXUS
begin taxa;
dimensions ntax=27;
taxlabels
0
1
2
3
4
5
6
7
8
9
10
11
12
13
14
15
16
17
18
19
20
21
22
23
24
25
26
;
end;
begin characters;
dimensions nchar=746;
format gap=- datatype=dna;
matrix
0 GTGGTCTCGTCTAGCTCCTCTGTACCGGTGCCTTGATCACTCCGGTGCGATTAGGGCTATCGATTGTATCACACTTCTATCCTCCTTGCGGTATGCACCCTTGCACGACAGGTTGCAGCCTTTGGCGGTTCTCGTCTGGGGAATTTTCGTGCTGTACTTTTCCGAGGGCTTAAAATATAGACGCCCTTGGCTAAACACGATGGCACTCCGATCTGAACTATGTAGCCGCGCTGGCCGCCTTTTATGATGTTGTATCTTGCTTGAACCGGCGTGCCAAAAAGTAGACGGCTTGTCGGGATTCCATGGGTCCTTGCCGAGCGCGTTTTCCTAGACTGGATGATCAGCCTTCCCTCGCACTGAGTAAAGGAAAAGATTCAATCTAACCTTCGTTACTCACTCATTCCATGTGGCTTCGATAGAGAATTGGCTAGGCTCCTCGCTCAATGAATTTGAGCGAGCAGGGACCACTAGGGCAGCCGGTCCACTCTCGTCTCATAGGAGTGGGGTCCAATGTAAGGGGATCAGCTCTACCATTGCAAGGGGGCTACAACATGAACTAAAGCGTTGCCCTGGCTAACGTTCTCAGAATTACTATCCCAAGGAAATGGAGCAGGGAGTCCCGGCCCTCATGGGCAATCTGGACCGCCCCTATAACTGCTTAAACCTGGTTAGAGTTCTATTAAATAGGAGGCGGGTGTTCCACGCACGTGCCACAGTTATCACAACGTCTTCGGAATCCGGTTGTC
1 ———————————————————————————————————————————————————————————————————————————————————————————————————————————————————————————————————————————————————————————————————————GGCCGAGTCATTCACCTAGGGGACAA—————————————————————————————————————————————————————————————————————————
2 —————————————————————————————————————————————————————————————————————————————————————————————————————————————————————————————————————————————————————————————————————–CGGCTAGCTCCTGAAGTTCGCTATCAAGT—————————————————————————————————————————————————————————————————————————-
3 ATGCCCCGCAGTATTGGACTAATGATAACGTTTTGATTGATGGCTACGCGAACACATGCTAGCTCTCCCTAGTTACGCTATAA—AAACCACC———————-CGCGGTTAA——TCGGCTTCTTGTGGGTGCATGGTCAAATGCCCTCATTACCAGTTCACTCCTGGAT—————————–GAGCACGTCTGGCCATGCTTTTATCCAGAGCAGGACTGTGTGAACAAGGAGA——————————————————————————————————————————————-GATCACGAATGACGTGGATCATCGTTGGAC——————————TCGTTCGACACTATTG——–CTGAG-AAAAAGACTCTAAAATAATCTCAGAGGCGTATTTCTCCGACTCCACAGC——————————CCCTCTACAATTCAGCGTCGTTTAG————————————————————————————————————————————————–
4 ——————————–TAATTTATTAGTTGTACAGAATAAAAACCACCCGCGGTTAATCGGCCGGCCC—-AACCGACTCAGCGGACGTGAGCACGTCTGGCCATGCTTTTATCCAGAGCAGGACTGTGTGAACAAGGAGAGGAAAAAACGGATTAGGCGTAACGGCGTCATCACTCAACGCATTCTGACGGTTCTAGCAGGGCCGTTGGGAGTGCTCCATTAGCTAGGCCATTTGTCCAATCATTTTATCCTTACCTAAGAAAAGCAGATTGCT-AACCTTGTGTAAGCCCCGATCACTGATCACGAATGACGTGGATCATCGTTGGACAGATCGTTACCT————————–CACGTGCAATGTGACAACTGTTGGAAGGGTCGATGAACAAAGGTCGTTCGACACTATTGCTGAGAACTAGCTACCGTTATATGGGTGTGCCTCTTCGAAGGTTGGTGCGCTAAAAAGACTCTAAAATAATCTCAGAGGCGTATTTCTCCGACTCCACAGCCCCTCTACAATTCAGCGTCGTTTAGATGCCCCGCAGTATTGGACTAATGATAACGTTTTGATTGATGGCTACGCGAACATTCTTGTGGGTGCATGGTCAAATGAACAAATCAGGGGCTGAGGGCCCTCATTACCAGTTCACTCCTGGATAGAAATTACAAAAACATTCCAAGTTGCCCTGTGCCCGTGAATATGCGCGAGC
5 ATGCCCCGCAGTATTGGACTAATGATAACGTTTTGATTGATGGCTACGCGAACAAAAAACCACCCGCGGTTAATCGGC————————————–CGCG——————CCCCGGGCTGCA—–GACGTCCCTCATTACCAGTTCACTCCTGGAT—————————–GAGCACGTCTGGCCATGCTTTTATCCAGAGCAGGACTGTGTGAACAAGGAGACGC————–GGATGGACA———ATAGTGCTCGCGACGATGCAGAGACGG————————————————————–CGAGGGCTACAAACAGATCACGAATGACGTGGATCATCGTTGGACTCG—TTCGACACTATTGCTGAGGTGGCATAGTACGCATTGATTA——–ACATGCAAAAAGACTCTAAAATAATCTCAGAGGCGTATTTCTCCGACTCCACAGC——————————CCCTCTACAATTCAGCGTCGTTTAG————————————————————————————————————————————————–
6 ——————————————————————————————————————————————————————————————————————————————————————————————————————————————————————————————————————————————————————————————————————GGGGTTTAGCGTGAGTAGCCACACGGCCTAATCTTCCATCGTACACACGCGGTTTTACACAAAAACGAGACAGTCGGAGGTTGGGTTGATCGACGACATGAGCA————————————————————————————————————————————————
7 ———————————————————————————————————————————————————————————————————————————————TTTTGATTGATGGCTACGCGAACAAAAAACCACCCGCGGTTAATCGGCCCCTCATTACCAGTTCACTCCTGGATGAGCACGTCTGGCCATGCTTTTATCCAGAGTGACGCACAGCTCCGTAA—————————CATTCGTAGCAGGACTGTGTGAACAAGGA-GAGATCTCCCTTCGCGCGGCCGCGCGTTGGATCACGAATGACGTGGATCATCGTTGGACTCGTTCGACACTATTGCTGAGAAAAAGACTCTAAAATAATCTCAGAGGCGTATTTCTCCGACTCCACAGCATTTCCCAAAGGAGAGCGGCGGTCAGGGC-CCCTCTACAATTCAGCGTCGTTTAGCACGACCTGTATCACGAGCA——————————————————————————————————————————
8 ATGCCCCGCAGTATTGGACTAATGATAACGTTTTGATTGATGGCTACGCGAACAAAAAACCACCCGCGGTTAATCGGCTGAAAGCTAAAATACTAACAGGAAGTAGACCGTGCCGACGTGGTTACAGGCGCTCCAATTCTTGTGGGTGCATGGTCAAATGCCCTCATTACCAGTTCACTCCTGGAT—————————–GAGCACGTCTGGCCATGCTTTTATCCAGAGCAGGACTGTGTGAACAAGGAGATGTCATTTAGTGAGCTGAGTCCACCG———GAACTGCACTAGACGAGTCAGAATTATATTAGAAGGTGACCAACCAGCATATTATAGCTAGGCCATTTGTCCAATCATTTTATCCTTACCTAAGAAAAGCAGATGATCACGAATGACGTGGATCATCGTTGGACACAACTGTTGGAAGGGTCGATGAACAAAGGTCGTTCGACACTATTG——–CTGAG-AAAAAGACTCTAAAATAATCTCAGAGGCGTATTTCTCCGACTCCACAGC——————————CCCTCTACAATTCAGCGTCGTTTAG————————————————————————————————————————————————–
9 ———————————————————————————————————————————————————————————————————————————————————————————————————————————————————————————————————————————————-AGTCATACGGGCAACTCGAGTAGCCTAATCTTCCATCGTACACGAGAACGGGGCCACCAGCTGGGCGACAGCGTTAGAATCTGGGTCTGCCCTATCCGATCCCCGCTCGTATGTTAGCCATGATTCTCTTACTGCCCGAGTTGAAAACTAGCTACCGTTATATGGGTGTGCCTCTTCGAAGGTTGGTGCGCTGGGGTTTAGCGTGAGTAGCCACACGTAGGATCGTAGCCCCGTAGGACCGCC————————————————————————-
10 —————————————————————————————————————————————————————————————————————————————————————————————————————————————————————————————————————————————————————————————————————-GCTGATATCAATAGACCCTCATTTTCAACTTTGCTGTCGCCTGAATGTCG——————————————————————————————————————————————————————————————————–
11 ——————————–TAATTTATTAGTTGTACAGAATAAAAACCACCCGCGGTTAATCGGC—————————TGAGCACGTCTGGCCATGCTTTTATCCAGAGCAGGACTGTGTGAACAAGGAGA————————-CGTCATCACTCAACGCATTCTGACGGTTCTAGCAGGGCCGTTGGGAGTGCTCCATTAGCTAGGCCATTTGTCCAATCATTTTATCCTTACCTAAGAAAAGCAGATTACGGAATAACCCGCATCTACCGATCGTAGATCACGAATGACGTGGATCATCGTTGGACAGATCGTTACCT————————–CACGTGCAATGTGACAACTGTTGGAAGGGTCGATGAACAAAGGTCGTTCGACACTATTGCTGAGAACTAGCTACCGTTATATGGGTGTGCCTCTTCGAAGGTTGGTGCGCTAAAAAGACTCTAAAATAATCTCAGAGGCGTATTTCTCCGACTCCACAGCCCCTCTACAATTCAGCGTCGTTTAGATGCCCCGCAGTATTGGACTAATGATAACGTTTTGATTGATGGCTACGCGAACATTCTTGTGGGTGCATGGTCAAATG——————–CCCTCATTACCAGTTCACTCCTGGA—————————–CTGTGCCCGTGAATATGCGCGAGC
12 —————————————————————————————————————————————————————————————————————————————————————————————————————————————————————————————————————————————————————————————————————————AAATCAGCCTTACAATATTGATATTCAG——————————————————————————————————————————————————————————————————————-
13 ————————————————————————————————————————————————————————————————————————————————————————————————————————————————————————————————————————————————————————————————————————GAGCATGTGTACTCGAACTATAT—————————————————————————————————————————————————————————————————————————
14 ——————————————————AAAAACCACCCGCGGTTAATCGGC————————ATAGGAGCAT-TCCACCTGTAGTAGTCCCT————————————————————————————————————————————————————————————————————————————————————————————————————————————————————————————————————————————————————————————————————————————————————————————————————————————–
15 ——————————————————————————————————————————————————————————————————————————————————————————————————————————————————————————————————————————————————————–GCCTAATCTTCCATCGTACACATGCAAGGCGCACCCAATCCACT–CAGCGTTAGAATCTGGGTCTGCCCTATCCGATCCCCGCTCGTATGTTAGCCATGAT———————AACTAGCTACCGTTATATGGGTGTGCCTCTTCGAAGGTTGGTGCGCTCGTACCCGG—AAGCGGACACGTT—————————————————————————————————
16 ATGCCCCGCAGTATTGGACTAATGATAACGTTTTGATTGATGGCTACGCGAACAAAAAACCACCCGCGGTTAATCGGCACATCCGCATACGTCGCTAAAAATAGTTTCAATCACCAGAAGATGGCTG———TTCTTGTGGGTGCATGGTCAAATGCCCTCATTACCAGTTCACTCCTGGATAGAAATTACAAAAACATTCCAAGTTGCCTGAGCACGTCTGGCCATGCTTTTATCCAGAGCAGGACTGTGTGAACAAGGAGATAGCTAGGCCATTTGTCCAATCATTTGGCAGCAATATGATGACTGGGTTGGATCACGAATGACGTGGATCATCGTTGGACACAACTGTTGGAAGGGTCGATGAACAAAGGACAGGAATCTTGCACTCAACATTGTCGTTCGACACTATTGCTGAGAGGCAGTACATGCAAAGTATGAAGTCTAACTAGCTACCGTTATATGGGTGTGCCTCTTCGAAGGTTGGTGCGCTAAAAAGACTCTAAAATAATCTCAGAGGCGTATTTCTCCGACTCCACAGC——————————CCCTCTACAATTCAGCGTCGTTTAG————————————————————————————————————————————————–
17 ——————————————————-GAGCCCCAAAGGAGCTAACC———————————————————————————————————————————————————————————————————————————————————————————————————————————————————————————————————————————————————————————————————————————————————————————————————————————————————————————————–
18 ATGCCCCGCAGTATTGGACTAATGATAACGTTTTGATTGATGGCTACGCGAACAAAAAACCACCCGCGGTTAATCGGCACATCCGCATACGTCGCTAAAAATAGTTTCAATCACCAGAAGATGGCTG———TTCTTGTGGGTGCATGGTCAAATGCCCTCATTACCAGTTCACTCCTGGAT—————————–GAGCACGTCTGGCCATGCTTTTATCCAGAGCAGGACTGTGTGAACAAGGAGATAGCTAGGCCATTTGTCCAATCA—————————GATCACGAATGACGTGGATCATCGTTGGAC——————————————————TCGTTCGACACTATTGCTGAGAGGCAGTACATGCAAAGTATGAAGTCTGT———-TGGTATGAAAACACTTCATTG——–CCTAACAAAAAGACTCTAAAATAATCTCAGAGGCGTATTTCTCCGACTCCACAGCTATTATTGAGGCTCGCTGCGAGTTAGCACGCCCTCTACAATTCAGCGTCGTTTAG————————————————————————————————————————————————–
19 —————————————————————————————————————————————————————————————————————————————————————————————————————————————————————————————————————————————————————————————————————-AAAAAGACTCTAAAATAATCTCAG-TA—ACTTTGCGAATATCTAAT———————————————————————————————————————————————————————————————————-
20 —————————————————————————————————————————————————————————————————————————————————————————————————————————————————————————————————————————————————————————————————————CAAAGATCTTCTGTTGCCCACCGACGGGATCACGA-ATGACGTGGATCATCGTTGGACTGAGCACGTCTGGCCATGCTTTTATCCAGA——————————————————————————————————————————————————————-
21 ——————————————————————————————————————————————————————————————————————————————————————————————————————————————————————————————————————————————————————–TTTTGATTGATGGCTACGCGAACAGCCTAATCTTCCATCGTACAAAAAAGACTCTAAAATAATCTCACCTG—GATTTGCTAACATCGAGCCCAGCGTTAGAATCTGGGTCTGCCCTATCCTCGTTCGACACTATTGCTGAG——————————————————————————————————————————————————-
22 —————————————————————————————————————————————————————————————————————————————————————————————————————————————————————————————————————————————————————————————————————AACCGGAGCTGGCGCGAACGCTGGGGCC——————————————————————————————————————————————————————————————————————————-
23 ———————————————————————————————————————————————————————————————————————————————————————————————————————————————————————————————————————-ATACAATGA-GAGGTCTACGG——————————————————————————————————————————————————————————————————————————————————————————————————————————-
24 ————————————————————————————————————————————————————————————————————————————————————————————————————————————————————————————————————————————————————————————————————————-CACGGATGCGCCTCTCATACTCGTTTCT———————————————————————————————————————————————————————————————————————
25 —————————————————————————————————————————————————————————————————————————————————————————————————————————————————————————————————————————————————————————————————————————————————————————————————————————–CGGGAGAAGTAAGTGCCGATAGC———————————————————————————————————————-
26 ————————————————————————————————————————————————————————————————————————————————————————————————————————————————————————————————————————————————————————————————————CCATAACGGTATGCCTAGGTGTTTGTGGTCAACTTTGCTGTCGCCTGAATGTCG——————————————————————————————————————————————————————————————————–
;
end;
begin paup;
outgroup 1;
end;
John Harshman,
I’d hope Eric will check his post for comments soon. There seem to be a few queries to answer.
Here you go: https://pastebin.com/rpijxwgS
I tried pasting it in a comment, but comment gets spammed.
EricMH,
Ah, there was a bug that caused comments to disappear on editing which I thought had been fixed. If you tried editing after posting and it disappeared, perhaps the bug is back.
ETA: it was in the spam filter. It doesn’t display very well.
The technical questions can be answered by a careful reading of the post. The more theoretical/psychological questions will need to wait to the weekend. I appreciate everyone’s input.
They cannot.
EricMH,
That’s not even a valid NEXUS format file. The sequences, even with gaps, are of wildly different lengths. The alignment appears to be problematic too.
What makes a valid NEXUS format file? I can run it fine in PAUP. Is it not working for you?
For the alignment, I pasted sequences into ClustalW and then transferred the result to the NEXUS file. Is there something else I should do to produce a proper alignment?
John Harshman,
Your second attempt produced a file that could be massaged to make a valid NEXUS file.
Did a quick parsimony bootstrap and, as expected, the 50% bootstrap consensus tree had almost no structure. There are a few pairs of taxa with high values (up to 99%), but I’m pretty sure those are just taxa that are almost identical by descent. You really can’t show that non-phylogenetic data are as hierarchical as phylogenetic data if you generate the data using a partially phylogenetic process. The high-bootstrap pairs are taxa 4 and 11, 16 and 18. If anyone knows how these taxa are related, I’d be interested in knowing.
EricMH:
Based on the way you produced these sequences, a valid alignment would have either identical sequence or gaps at all positions for any pair of taxa. Clustal is a poor alignment program even for real data; for pathological data it has no clue.
Hey Eric, how do you generate the figure that accompanies your OP that shows the real “genealogy” of your DAG “taxa”? It’d be interesting to compare the inferred history output by standard tree algorithms to the actual history generated by the DAG.
I believe that the terminal taxa are the ones in the diagram that have no descendants. In the one he shows above, I count 11.
Can you recommend a tool I can use to align my data?
This is less user friendly. You’ll need to be using Linux.
1. install Graphviz
2. download the code from https://repl.it/@EricHolloway/Phylogenetic-Signal-Fallacy-Nucleotide-Level#main.py
3. in the code’s directory, create directory path ‘graphs/mygraph/’
4. at the bottom of the code, indented properly, add the function call:
viz_graph(“mygraph”, graph2dot, dag_graph, 0)
This will generate a png at ‘graphs/mygraph/0’ with the ‘true’ structure that generated the dataset of that particular script run.
I generally align by eye, which for most data is more reliable than any tool. But any alignment tool assumes there is an alignment to find. A proper alignment for your data would be what I described: each “gene” aligned perfectly with its identical sequence in all taxa that have that gene, and with gaps for each taxon that lacks the gene.
I’m a newbie to this, but I pushed a button named ‘bootstrap’ in the PAUP tool, and it created a tree like this, which has most numbers on the branches > 70. I looked online and 70 seems to be the rule of thumb cuttoff. So, it looks like I got a well supported tree out of the dataset (attached to this comment). Can you recommend how to go about reproducing your analysis that shows a lack of structure?
I believe that’s what I have. Can you point out specifically what is wrong with the alignment I did?
No. I don’t know what you did. If you just pushed the bootstrap button and, I presume, just clicked through the subsequent screens, you’re getting default options for everything, and I’m not sure what the defaults all are. Something seems to have biased all your searches. I’m guessing a simple addition sequence with limited branch swapping, but who can say? Now, I did a quick search with random addition sequence, limited to 100 trees per rep, and TBR swapping.
Then you are using a different data matrix from the one you uploaded. I see immediately that taxon 0 has a completely different sequence right at the start than all the other taxa that don’t have gaps at the start. And that sort of thing happens at various other places, with some pairs of taxa having disagreeing sequences.
Generally speaking if you’re trying to show that you’ve found a non-tree-like way to produce data expected from a tree-like evolutionary process of branching descent with modification, you need to show that there really is no tree-like branching descent with modification, as in genealogical history, in your method, and that it nevertheless produces data that just makes it looks like there is.
Now the problem is that it’s pretty obvious that there is real branching tree-like descent going on in your process. And the modification part comes from accumulating insertion segments from other lineages.
What John said.
Looking at the DAG I see the statements that each colored box was a gene, whose initial DNA sequence was a random one. As they flow down through the diagram, is the sequence of one gene (one particular color of box) changing? Or are they staying the same? In the former case, if we aligned them using our knowledge of which gene was which, each column of the alignment matrix would contain identical nucleotides (such as all Gs) as well as gaps. If we instead took the sequences and ran them through an alignment program, it might find the same alignment, or maybe a bit of a “mares nest”. If it aligned properly and there had been no change during inheritance of the sequences, that would result in a low consistency index, i.e. the parsimony score at each site would be zero (unless you counted change to/from gaps).
And, to second what earlier commenters said, if you compare sequences generated on a partially-treelike genealogy to sequences that evolve independently of each other from a single ancestral sequence, of course you get some signal of treeness. That’s because your data set did evolve with some genuine common descent. The C.I. is detecting genuine evolution, just not perfect treelike evolution.
I think they stay the same. The only change that occurs as far as I can gather, is that genes can accumulate over generations, and this always occurs horizontally.
I’m guessing Eric did his alignment with parameters that included a gap extension penalty. (Evidence : both 4 and 11 end in CTGTGCCCGTGAATATGCGCGAGC, but his alignment fails to capture this.)
Given the way he set up his ‘graph’, that seems a strange choice…
I am relieved to see that even a rank amateur such as myself can spot the other, deep-sixing problem with Eric’s approach.
Based on the description and on the data matrix, no. “Homologous genes” are all identical.
Actually, I believe the consistency index would be undefined: 0/0. There being no required steps, all trees are equally parsimonious. Then again, I don’t know where taxon 0 comes from, but it seems to be a random sequence with no gaps, unrelated to any of the genes. So approximately 75% of the sites would show exactly one change, happening between the root and the rest of the tree, and 25% would show no change. That still makes for an undefined CI, but there would be a non-zero length for one branch.
In short, all the potential data conflict arises strictly from Clustal’s bad alignment.
ok. This made me laugh. 🙂
So there you have it Eric. Just align by eye. Your results should be about as good as John’s.
I wonder what the CI scores are for eye-based alignments vs tool-based alignments.
That’s because you are in happy ignorance of the subject, right? You have never aligned any sequences in your life and have no idea how it should or should not be done, right? Do you even know what “alignment” means here?
Incidentally, alignments don’t have CI scores. Trees on which data are optimized have CI scores.
You’re quit right. I meant to say “high” consistency index, but said low. But 0/0 is the right answer.
Duh. Trees costructed from John Harshman’s personal eyeball alignments?
Have you compared your eyeball alignments with those of Joe Felsenstein?
Maybe. Maybe not.
Right. But here’s what I do know. Results ought to be repeatable.
Have you published your eyeball alignment process and demonstrated its repeatable consistency?
How is anyone else supposed to replicate your results? What if their eyeball alignments differ from yours?
Science, John. Eyeball alignments don’t cut it. That’s why people write programs which produce repeatable results. That you reject these programs and choose to rely on your own personal subjective opinion is revealing.
Congratulation on waking the Mung Troll and getting him out of his troll lair.
Sorry. He’s been asleep?
One grows so tired of ignorant, arrogant trolls. I suppose I will ignore you.
Poor Galileo, he only thought he was doing science.He should have written a program.
As someone who pretends to be a programmer you should know that writing and designing programs are two quite different things.
If you don’t understand the underlying structure there is little point automating something with a program. This is amply demonstrated by this very thread. Eric uses tools he does not understand to ‘prove’ something he also does not understand.
Someone can do something ‘by eye’ that vastly improves on the best a program can do. And some programs can do vastly better then ‘by eye’ of any human. In this case you have credentialed experts telling you the limits of such programs but because you are pretending to be a programmer you only have the one hammer to swing and swing it you do.
Tell me Mung, these people who write programs that produce repeatable results. Do they also design those programs? Is the expert knowledge required to perform a procedure the same knowledge required to automate that same procedure?
Given the role of you, a pretend programmer and John, a credentialed domain expert, who is the person designing the program to produce repeatable results?
You are a mere coder for hire, you produce what you have been asked to produce to a given specification. You appear to be under the foolish illusion that all expert knowledge can easily be reduced to a computer program and that experts doing things with their expertise can always be improved upon with a computer program.
As I say, you only have the one hammer.
But you thought you’d disconfirmed a basic part of our understanding of evolution?
Arrogant much?
Gel electrophoresis, and other chromatographic separation methods, typically use eyeballing, rather than ‘a program’, to check alignment (eg of DNA fragments). They’re reasonably scientific.
$100 say despite that, Eric will publish his “findings” at MindMatters or the likes, pretending to be an expert and cocksure of having debunked common descent
Please allow yourself a moment’s thought here. An alignment is basically just that, making two or more sequences align.
When scientists publish phylogenetic trees, which are inferred from alignments, they include the alignments themselves(usually in supplementary information documents). That way it becomes trivial to replicate the alignment, you simply look at the alignment that comes with the tree and then you can see how it was done. So to answer your question: By simply looking at it.
A scientist is given three DNA sequences:
TAAGTAAATTAATC
AAAGTCAAATTAATC
AATCAATTAATG
Then aligns them (by eye) like this:
TAAGT_AAATTAATC
AAAGTCAAATTAATC
_AA_TCAA_TTAATG
And then includes that alignment with their paper. Now, how do you replicate this alignment? By looking at it. By simply looking at it you can see what was done. Symbols were inserted in particular spots to make the sequences align. And we can see how this was done by… looking at where the symbols are.
How do we replicate this? By… inserting the symbols in the same positions as we see in the alignment.
Wow. That was truly difficult to figure out.
Then it will look different when you look at it.
John Harshman,
I am not sure why his point should be dismissed. Is there a process for “eye ball” alignment? If there is then describing it should deal with the issue. If there is no standard then should one be developed?
The bigger question in my mind is if you are really testing common descent or basing your results on the assumption it is true and as non linear argues curve fitting.
‘Non linear’ talks a lot of shite.
It is simple hypothesis testing – that’s what you do throughout science: assume x is true (or false) then see how well supported the hypothesis is.
Well of course you aren’t. You know as much about alignment as Mung does.
And of course there’s a process. You match up regions of similar sequence, taking transistions as less problematic than transversions, introducing gaps where needed to line up long regions. The more similar the sequences are, the easier this is. And you can check your alignment against someone else’s alignment of the same sequences.
In the case of Eric’s data, where the sequences are absolutely identical over 20-30 bases, it’s easy to recognize what should line up. It’s made more difficult by the long gaps needed.
Allan Miller,
No doubt but there are a few pony’s there also.
The problem is the technique does not directly test the hypothesis. There is no objective test of common ancestry other then closest fit. Where does common ancestry fail in this test? There is no independent testing of the basic assumptions.
The closest fit (sequence comparison) shares a common ancestor. As John describes he is parsing out DNA without real knowledge of what it does. We forget this long segment of nucleotides builds an animal from a single cell.
Do you disagree we are in the early part of the first 45 in this soccer match?
What would help is other independent comparisons such as Winston is doing with gene families.
Of course there is, or there would be if there were an accepted model of what non-descent would look like. Should unrelated sequences be alignable? Notice, by the way, that we are currently talking about alignment, not phylogenetic analysis. You seem to have confused the two.
When did I say any such thing? But of course in aligning sequences it’s only minimally helpful to know what it does. It would help somewhat to know it the sequence was protein-coding, but in such a case knowing its function would be useless.
Your main problem is that we’re playing volleyball and you think it’s soccer.
Pointless work. The dependency graph can make a perfect fit to any presence/absence data at the cost of introducing countless ad hoc categories.