
Allan Miller’s post Randomness and evolution deals with neutral drift in the Moran model applied to a bag of M&Ms. Much of the discussion has focused on the question of counting generations in a situation where they overlap. I think it’s a good idea to divert that part of the discussion into its own thread.
Here are the rules. Start with a population of N M&Ms. A randomly chosen M&M dies. Another randomly chosen M&M gives birth to a child M&M. Repeat.
Because the focus of this thread is generation count and not fixation, we will pay no attention to the colors of M&Ms.
How do we count generations of M&Ms?
- My recipe. Count the number of deaths and divide by N. It can be motivated as follows. A single step (one death and one birth) replaces 1 out of N M&Ms. We need at least N steps to replace the original M&Ms.
- Joe Felsenstein’s recipe. The original M&Ms are generation 0. Children of these M&Ms are generation 1. Children of generation n are generation n+1. The generation count at any given point is obtained by averaging the generation numbers of the population.
- Replacement recipe. A generation passes when an agreed-upon fraction of the current population (e.g., 90 percent) is replaced.
Numerical experimentation with the Moran model shows that recipes 1 and 2 give similar generation counts in a large population, say, N=1000. I suspect that the third recipe will give a generation count that differs by a numerical factor. In that case one can select the “right” fraction that will yield the same count as the first two recipes.
Have at it.
ETA. Let us define generations as Joe did (definition 2 above): the original organisms are generation 0, their children are generation 1, and so on. Let us call N deaths and N births one cycle.
I wrote a simple Mathematica script that plots the distribution of generations after a given number of cycles. Here are a few representative histograms for N=1000 organisms after T=100 cycles.
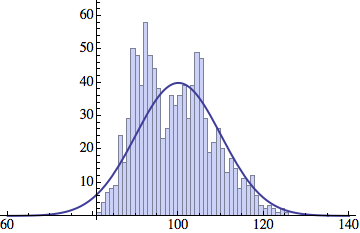

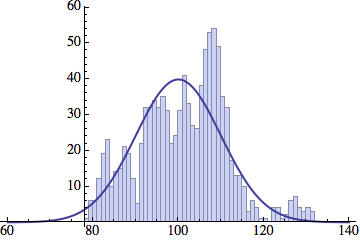
The curve is the Gaussian distribution with the mean equal to the number of cycles T and the standard deviation equal to the square root of T.
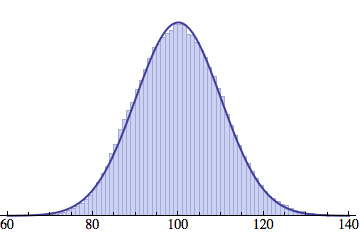
Averaging over 100 different runs (each with a population of 1000) gives a distribution that is nicely reproduced by the Gaussian curve:
And here is an animated GIF file showing the evolution of the generation distribution with time (in cycles of N deaths and births).
Joe Felsenstein pointed out if we follow the distribution of generations to times t longer than N, we will find that its width stops growing and remains around the square root of N/2. (Here is also my take on it.) The animated GIF below shows longer-term behavior of the distribution, to t=1000 in a population of N=1000. You can see clearly that toward the end of this interval the distribution is narrower and taller than the Gaussian it is supposed to follow.
If I understand your recipe #3, then it will match recipes 1 & 2 when the threshold replacement fraction = 1 – 1 / e,
since after n iterations 1 / exp (n/N) will remain unreplaced.
Any of those methods looks fair enough.
In real life, generation counting is at best a crude measure anyway.
I suppose the aim of the thread is to explain this to one particular commenter. But I suspect that is a lost cause.
How difficult would it be to write a sim that compares the different generation counts?
I have a c++ code that does just that for recipes 1 and 2. See this comment. It should be easy to write a simulation comparing all three.
I once encountered a 45 year old great great grandmother, so I’m familiar with the complexity of counting generations in a population.
I think phoodoos mathematical reasoning flies out the window on the emotional issue of comparing actual reproduction with the replacement process used in the sim.
All the fun, mathy stuff happens when I am tied up with other things.
The concept of what is meant by a generation in this simulation seems a bit nebulous to me.
When we refer to the “baby boom generation” (“Boomers”, 1946 – 1964), or “Generation X,” or “Generation Y,” we are referring to overlapping populations that have somewhat arbitrary boundaries but have certain defined characteristics in common.
In genealogy, we refer to parents, grandparents, great grandparents, etc. as separate generations, but that is within a given family. We also talk about our “parent’s generation” or “grandparent’s generation;” which now covers more than one family and instead covers an age range of people who grew up together.
As far as the dispersion of, say, a particular genetic trait within a population is concerned, the model suggests that one reproductive cycle – i.e., one outer loop of the program – is a generation. It doesn’t identify any subpopulation with a specific trait.
So, as far as evolution in concerned, do we identify a “generation” as a population in which the majority of its members have the trait?
What does generation mean in evolutionary terms? Is there a technical definition for “generation” in evolutionary theory?
Heh! I had a similar OP in preparation, but thought that issue might have run its course!
My original ‘M&M’ post started life as a comment in one of the ‘chance’ threads, before I decided to turn it into an OP instead. Thanks to phoodoo for giving it legs! Lots of ’em.
Wikipedia have a mathy-looking entry on generation time.
Mike Elzinga,
Mike,
The ‘generation’ has much the same meaning as in everyday life – a copying step, esp. reproduction. Every offspring of a parent is one generation removed from that parent, and so on incrementally down the ages. The small difficulty arises when we run a population of individuals and a time series of changes. Since there is variance in the actual time taken to reproduce, the generation count along different lineages will vary also. The population as a whole has a mean generation count relative to the starting population, but individual lineages follow a distribution. It happens that for sufficiently large N a ‘mean’ generation approximates to N births in this ‘steady state’ model. After N births & deaths some lineages will have had more than one, some fewer, but the population mean has moved on 1.
No.
Alan Fox and Allen Miller:
Thanks. The math at that Wikipedia link makes sense; those are consistent with many other averages and expectation values.
There is no single definition, but as long as one defines something like what is in those definitions in at Wikipedia, others can know exactly what one means.
I can see defining “generation” as a certain number of births, eg N births for population N.
I’m surprised more biologists don’t suggest this, since births are what we’re going to be concerned with when we’re looking at whether a trait can spread and end up fixed in the population.
It has the disadvantage that N needs to be recalculated each “round” unless you’re running a steady-state simulation which has N deaths imposed each round. It has the advantage of closely matching some animal and plant populations which might make sense to folks like phoodoo: anything that survives the “winter” gets a chance to reproduce “next spring” [regardless of whether it was parent or child in the previous round], and if we don’t have a hard winter with a number of deaths, we do expect a larger N of births in the next generation.
In a steady state, counting generations by number of births gives the exact same results as recipe 1, counting by deaths. I don’t suppose it really matters as long as we can agree on a definition for use in these simulations.
I have suggested a definition in the previous thread — it is consistent with the second of the definitions in the Wikipedia entry. All of these reasonable definitions agree that in the M&M case the generation time is the number of M&M’s, which is N.
Actually the behavior of the M&M process (a Moran model) can be studied and understood without ever defining a generation time. Each step forward in the M&M model is the death and replacement of one M&M, and one just works in these steps.
Anyone who thinks that we need to use a generation time to understand this process should present their case.
I’m on record as saying it is irrelevant for these sims.
(Phew! I’m off the hook)
Alan Fox,
Everyone is! Everyone, that is, except …
Some posts didn’t conform to the rules and have been moved to Guano. Feel free to repost within the TSZ rule set!
Some posts didn’t conform to the rules and have been moved to Guano. Feel free to repost within the TSZ rule set!
I suppose knowing the generation time for a particular model is only interesting if one wants to compare different models (e.g. Moran vs. Wright-Fisher – but note that they also differ in the variance of the number of offspring per individual) or the model vs. reality. I think it’s the latter aspect that phoodoo was ‘worried’ about. Maybe we should link to some experimental results showing how long it takes for drift to fix alleles, but I’m too lazy to do that (although I know such results exist), and too exhausted from babysitting my demanding little son…
The M&M sim is a population of N haploid individuals. If we compare it to a haploid Wright-Fisher model, they differ by a factor of 2 in effective population size. So the M&M model will drift twice as fast per generation. The WF model actually has discrete generations. The prediction would be that they would be very similar in their time behavior if you compared N/2 single M&M sampling events and made that the same amount of “time” as one WF model generation.
They are approximated by the same diffusion process, and in that comparison should give almost identical results unless N is quite small, say 10.
If you want to check this, you can simulate both, or in the two-color case one could be more precise by making up a transition probability matrix for each (one for one sampling step for the Moran model, one for one generation in the WF model) and then take the t-th power of the WF model matrix and compare it to the (Nt/2)-th power of the Moran model single-step matrix.
I don’t think any of your proposed suggestions takes into account the number one problem of the model. You need every M&M labelled in your population, so that you can see who is giving birth multiple times in the same generation, who is a newborn giving birth before their generation is over, who is giving no births per generations, and who is giving birth several generations down the line (as if they are a great grandmother giving birth among babies).
This kind of breakdown will display all of the nonsensical results.
Don’t forget you have to give each M&M a personal name too – Fred, Julie, Oscar – so they can send Christmas cards to each other. And clothes. Each M&M needs a special wardrobe so none of them feel inadequate and stop reproducing. And make sure some of them do dangerous things like motorcycle racing or skydiving to make their fitness value be more realistic.
If you do all those things and more then maybe phoodoo will bless your simple drift / fixation model as sufficient for his high scientific standards. Otherwise you’ll just get nonsense.
Feel free to come up with your own way to count generations. In fact, in the previous thread you proposed using the replacement recipe (number 3 in the opening post) with the fraction of 1, i.e., the time until all the original M&Ms are gone:
Your latest method (total replacement) will not work very well as some of the old-timers will linger for a while, so you might want to dial down the fraction to 90 percent, or something like that.
That’s just silly. Human generations are generally regarded as thirty years or so, but individuals can live to a hundred. In real populations, the duration of a generation is the average age at which individuals reproduce.
It’s not clear to me that phoodoo’s suggested modifications to the model are based on anything other than his garbled comprehension of what’s already been presented in the relevant threads here. That said, I also can’t see that his suggested modifications would hurt anything, so here’s my attempt at a model…
1: In this model, each M&M has its own unique ID label (which, being unique, cannot ever be associated with more than one M&M in the same run); its own color (which it may or may not share with however-many other M&Ms); and a list of its ancestors.
2: Each time the model is run, the guy who’s doing it sets up the initial conditions:
2.i: Initial population. This is an integer. If phoodoo has any insights to give regarding the size of the initial population, we can take those insights into account when setting up the model; otherwise, let’s say the initial population can be anything from (picking arbitrary numbers out of my hat) 1 to 10,000.
2.ii: Number of colors in the initial population. Another integer, whose starting value can be anywhere from 2 to 10, except if phoodoo has anything to say about the number of colors, in which case we again take phoodoo’s insights into account when setting up the model.
2.iii: The distribution of colors. Are all colors evenly distributed, are there 4 times as many red M&Ms as there are green M&Ms, whatever. If you want to have 1 M&M of one color, and every other M&M be a second color shared in common, go for it.
2.iv: Birth rate. This is a percentage, from 0.0% up to 100%. The way it works in this model is, we completely ignore the concept of ‘generations’. On each ‘tick’ of the ‘clock’, the model ‘rolls a die’ separately for each individual M&M. With a birth rate of 10%, M&M #1 has a 10% chance of reproducing; M&M #2 has a 10% chance of reproducing; M&M #3 has a 10% chance of reproducing; and so on, for each member of the M&M ‘breeding population’.
2.v: Death rate. This, too, is a percentage, from 0.0% up to 100%. On each ‘tick’ of the ‘clock’, the model ‘rolls a die’ separately for each individual M&M. With a death rate of 10%, M&M #1 has a 10% chance of dying; M&M #2 has a 10% chance of dying; M&M #3 has a 10% chance of dying; and so on, for each member of the M&M ‘breeding population’.
2.vi: Number of cycles you want the model to, er, cycle through before it stops running. This is an integer. It’s also an upper limit, not an absolute number; if the entire ‘breeding population’ becomes the same color at some point before this number, that’s when the model stops running.
3: After the initial conditions are defined, the model creates the defined number of M&Ms; assigns each M&M a unique ID label; assigns each M&M a color at random, in accordance with the defined number of colors and the defined distribution; and assigns each M&M a blank ‘list’ of ancestors.
4: Once the initial set of M&Ms has been created/defined, the ‘clock’ starts ‘ticking’. The following things occur on each ‘tick’ of the ‘clock’:
4.i: The model stores the current list of M&Ms, including all their various ID labels, all their various colors, and all their various ancestries.
4.ii: The model rolls its ‘birth-rate dice’ for each M&M in the current list. For each M&M whose die-roll said yep, this one reproduced, the model creates a new M&M. This new M&M has a unique ID label. Whatever color the ‘parent’ M&M was, the ‘child’ M&M has that color. Whatever ancestor-list the ‘parent’ M&M had, add the ‘parent’ M&M’s ID label to that list, and the ‘child’ M&M has that extended list.Each newly-created ‘child’ M&M is added to a list of This Year’s Kids.
4.iii: The model rolls its ‘death-rate dice’ for each M&M in the current list. For each M&M whose die-roll said yep, this one’s dead, the model removes that M&M from the current list.
4.iv: The list of This Year’s Kids is appended to the current list of M&Ms.
5: After all the births and deaths of the entire ‘breeding population’ of M&Ms have been accounted for, the model checks to see how many different colors exist in said ‘breeding population’; if there’s only one surviving color, the model stops running.
6: If the model has reached the cycle-number that was defined by the user, the model stops running.
How does this model satisfy your concerns, phoodoo?
phoodoo,
Nah, it’s not a problem at all. You don’t need to keep track of anything beyond current generation count per surviving member – you do need a list of the population, because you need to know something about them. But this list can include an array of stats about that member, additional to its colour – including generation count.
One just declares the population as a 2-dimensional array. Dimension 1 is simply a bucket to hold N members. Dimension 2 holds the parameters for the current member you have placed in that slot – allele, colour, something else …
In vba, that would be ReDim pop(popsize,params)
Param (1) is label, so you can keep track of each individual in the starting population – each number is unique to descendants of that individual.
Param (2) is colour, if you choose to represent that (you don’t need to; you have a unique label in Param (1) that you can regard as N different starting colours)..
Param(3) is generation count.
For each trial, initialise this array:
For p = 1 to popsize
  pop(p,1) = p
  pop(p,2) = colour (as you wish)
  pop(p,3) = 0
next p
Then start a-samplin’.
Every time you ‘kill’ such an individual, you replace it with a copy of another, inheriting all 3 parameters but incrementing parameter 3 by 1 from the ‘parent’s value. By this means, you keep an actual count of copies down a lineage, which you can count to get the population stats and compare to the approximation method. And you can note that the presence or absence of specific parameters makes no difference to the operation of the model.
… aaaand … you could add a parameter representing the individual’s ‘millisecond birthday’. You could use that to see if the absence of specific age-related mortality meant that some digital organisms were immortal (it doesn’t. The individual probability of survival is ((N-1)/N)^deaths. That works out at about 36.7% for N deaths, 13.5% for 2N, and so on. Even after 4 generations, you’re less than 2% likely to still be around. And it gets worse. 36.7% worse per increment of N.)
You could also add an ‘offspring count’ to the array, if you wanted to keep that statistic, preserving the maximum and mean elsewhere. And so on. The world is your lobster.
cubist,
Cubist, I pretty much stated what I think you would have to do, to show if you are dealing with a reasonable assumption that this can represent a generation (rounds divided by N theory). .
You have a starting population, for model purposes they all start off at the same age. Every M&M has a discreet label which identifies its generation, number of descendants, etc. If the M&M gets selected for a birth, it gets attached to its profile as to when it happened. Then run it for 10, 100, 1000, 10,000 and see what your results are.
See how many times you have results which are too illogical to make sense in a real world population. If only 1% of the results are silly, perhaps that’s an acceptable error rate. If ten percent of the results are silly, you may well have a problem. If 20% of the results are silly you definitely have a problem.
A silly result would be someone who is just added to the population in that generation, already giving birth to multiple babies. Another silly result would be someone from 5 generations previous giving birth to a baby. Another silly result would be a baby of a baby from a generation giving birth. Another silly result would be 30% of the population giving birth to no babies in that generation. Another silly result would be an individual giving birth across 3 or 4 generations. Another silly result would be one individual giving 30% more births then everyone else in a generation…etc.
Tally it up.
phoodoo.
People have actually done all this. Many, many people. Including contributors to these discussions. The mathematics of the situation have also been thoroughly investigated. You don’t consistently get results on the extremes of the distribution after numerous trials. Nor, if your N is large enough, do they deviate wildliy from expectation on even one trial.
And when I build all these metrics into the next version of my toy and it shows that outliers are, well, outliers, what then?
One thing phoodoo fails to appreciate is that many of the suggestions actually make neutral fixation happen quicker. And none of them stop it. The model as presented is the ‘fairest’ – probabilities are distributed exactly equally among all N members (On a technicality, ‘birth’ is only available to N-1 of them, because it only happens after a death).
Try and appreciate what happens when you start restricting the generative capacity of the population. Introduce a juvenile stage. This means that a percentage of the population in that stage cannot be selected for birth. Which means that the effective N for birth is the proportion that is NOT in the juvenile stage – this will be smaller than the census value. Ditto for an age-related cessation of breeding, or a gestation/nursing period. Reduce Ne and you speed up fixation.
Truncation of offspring number does reduce the contribution of a particular individual to the next generation, but that parameter affects the whole population equally. The probability of mortality alone is sufficient in the basic model to avoid unrealistic offspring numbers being born to one individual, but adding an explicit cap on offspring to an individual will have no effect on the inevitability of fixation – though it will tend to slow it down, if the cap is less than that achieved by mortality probabilities alone. But it will also reduce the effective population size – individuals exceeding their quota cannot breed – which will tend to speed fixation up! The resultant will depend on how restrictive the cap is.
Then show us the results and let people see for themselves if they think it demonstrates a reasonable cross section.
How many are outliers? That’s what needs to be seen. Allan seems to want to keep these results secret.
phoodoo,
Humans aren’t the only species on earth, and the model is not supposed to represent them or any other. When it does, appropriate parameters can be introduced. Presented is the ‘raw’ process.
An individual giving birth while great-great-great-grandchildren walk the earth requires only a reproductive period of 5 times the minimal generation length. Dogs can manage this.
The question is not seeing what alterations you can manipulate to see if it makes sense, the question is , does the proposition the way it has been presented here originally give logical results or not..Show it, then people can say, yea that looks like a reasonable cross section of breeding in a population, or no, that looks completely unrealistic. Simple as that.
phoodoo,
The results? Why, they support me in their entirety!
Would you actually believe anything I said?
This silly snipe:
I published results that showed that the mean and the extremes of the distribution of actual generation counts were not wild as you had supposed. Did you concede? Did you thank me? Did you acknowledge in any way, or ask to see more data (I could have cherry-picked)? Not that I saw.
You’d have to be a little more specific about the parameters you wish to adjust. And if you want me to put the effort in, I’d like to see some effort from you, too, to understand the model: what it is and what it isn’t.
But I will give you my vba code and you can run it. I can’t really say fairer than that. Let me ask again: do you have Excel?
Great, then lets see how well it works, and see what populations it can be applied to.
And you misstated the problem, its not whether or not great great great great grandchildren can reproduce while their ancestors still are alive, its whether or not great great great great grandchildren can give birth at the same time as their ancestors.
Where have you published the results of the process I stated? I haven’t seen that.
You still didn’t hear what i have said. I said make NO adjustments to the parameters. I simply said show what the results of the birth stats are given the parameters that you have originally proposed. One generation is equal to one round of N draws. Apparently that takes about 1000 rounds in a population of 1000, so let’s see how representative our generations really are.
phoodoo,
“Silly” is rather subjective. Consider the following statement:
That seems “silly” to me, but it is true, and leads to this observation:
Something you were originally convinced could never happen, viz (Jan 7):
Allan, Joe and others have explained the math to you – the behavior of these models is well understood. Personal incredulity is not evidence.
And phoodoo,
Allan has provided you with his results. For example
You are only going to believe this if you run it yourself.
Do you have Excel?
phoodoo,
You said this.
I said this:
Apart from pretty obviously, I meant their great3 grandchildren, not someone else’s (!) I’d say my response is exactly what you said; your later statement a clear misunderstanding of mine. And, either way, dogs.
Let the onlookers decide!
Ok, so when are you going to show the complete results?
Write your own sim, find out?
DNA_Jock,
Of course, you don’t have to run anything to get that particular result. For a probability of 1/N, a given trial has (N-1)/N of it not occurring. In this case, death. For N trials, it’s ((N-1)/N)^N, which happens to converge on 1/e for large N. You’ll survive N deaths 36.7% of the time, 2N deaths 36.7 * 36.7 = 13.5%, etc etc. The result, merged with the probabilistic nature of a new generation of descendants being created in any given N, is that the vast majority of these organisms don’t produce more than ‘a few’ generations of descendants before expiring.
I have not asked anyone to explain the math. You are free to make up your own mind about what you feel is an acceptable level of variation.
Until someone shows the completed stats of each generation as I have explained, just claiming the math is good is pointless. You people seem to spend a whole lot of time making assertions about the value of your formulas, instead of just presenting the data and letting anyone see how good it looks.
phoodoo,
When you tell me whether you’ve got the frigging environment! DO YOU HAVE EXCEL? I’d far rather you ran it yourself. (And … I have a life! I’m not here at your beck and call).
I didn’t make the extraordinary claims And besides Allan has already stated that many people have already done so, including him, so why is he so shy about just showing the raw data?
You have a life? You claim you have already done it, so what’s so hard about just showing what you have done?
phoodoo,
You can just copy and paste the data right here, why would anyone need Excel. The data isn’t just for me, its for all to see and judge for themselves how realistic it is. .
How will you judge that? You must already have an idea of what “realistic” entails or how can you make that judgement?
So, please explain what a realistic set of results would look like then we can compare them to the actual results.
What extraordinary claims, specifically?