
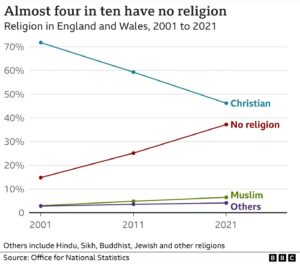
Results from the decennial census show that for the first time ever, fewer than half of English and Welsh citizens identify as Christian. The decline has been precipitous, as shown by the graph.
It appears that most of the Christians jumping ship end up in the ‘no religion’ category rather than converting to another religion. No data on how many of them still believe in a god or gods, or in a ‘higher power’. Also interesting that if established trends continue, the ‘no religion’ folks will become a majority in the not very distant future.
The graph comes from this BBC article.
Indeed. The straight line is a model for the intermediate value between two points in time. I already said “Well, yes. The simplest model for data points marked on a two-dimensional graph is a best-fit straight line.” That’s not the point (pun intended).
It occurs to me, we have a handy toy example in the stats plugin. It should be available to all registered users from their dashboard. The “Hits” graph shows number of visits and number of unique visitors on a daily basis. The points are prettily but pointlessly linked with a wavy line.
I’ll grant Keiths that a value such as the resistance variation due to change in temperature of the surrounding air in a platinum probe will be continuous, though lagging the temperature by a minute or so.
Alan,
You claimed, regarding my temperature example, that the line between the points reveals “nothing that you didn’t already know”.
I have explained, in considerable detail, why you are wrong about that. The line definitely tells us something. Do you accept that, or are you sticking with your assertion?
Or say I have a glass beaker, a thermometer and a stopwatch. I zero my stopwatch and place the thermometer in the beaker, while my assistant quickly adds boiling water to the beaker. I read the thermometer as I start the stopwatch. It reads 98°C.
The room in which I’m conducting the experiment is 22°C. I can tell you that after 60 minutes, the recorded temperature is 27°C. What is the temperature after 30 minutes? Is a straight line the best predictor of intermediate values?
keiths,
If all you have are two times and two temperatures, then no, setting them down on graph paper and drawing a straight line between them tells you nothing you didn’t already know.
In this example, the points are immune to a predictive mathematical model, I would think.
Or what about an example more relatable to the UK census data on religious affiliation.
Whilst the line joining the dots on the Trump polling data looks pretty, it adds no information.
Alan:
They didn’t join the dots. Look at how many aren’t on the curve.
Alan:
That’s incorrect. There is a polynomial that fits those points exactly.
Alan:
I’ve repeated this once, but it looks like I’ll have to repeat it again. Third time’s a charm, I hope.
From earlier in the thread:
Alan:
keiths:
My temperature example satisfies this criterion. The decrease in temperature over the span of 30 minutes in Tucson after sunset on a clear, calm day is unlikely to deviate much from a straight line. You yourself accepted my answer of 70° F, and that answer was based on linear interpolation, whether you grasped that or not.
Correct, the data from different polls has been averaged. Presumably, that produced points through which the lines pass.
My point is that it is an unwarranted assumption to assume change between two temperatures is exactly linear.
Coming from middle England and living on the edge of the Pyrenees massif, I’m used to a little more variety than I might expect were I ever to visit Tucson.
Alan:
In general, it actually tells you something false (see my previous comment). Are you saying that you already knew something that was likely false? Not good.
Let me explain. Suppose T1 is 3:23 pm on July 18, and T2 is October 3 at 1:42 am. Draw a straight line between the corresponding points on the temperature graph. Is that line a useful predictor of intermediate temperatures? Obviously not. (Though if you think about it, it will get some predictions exactly right — and I mean exactly right. But most of the time it will be wrong, and sometimes wildly wrong.)
As I keep repeating, linear interpolation is a bad idea unless you know that the intermediate values are unlikely to deviate much from a straight line. In the case I just described, that criterion is not met. The temperature will be swinging up and down on a daily basis. In my earlier Tucson examples, however, that criterion is met. Any deviations from a straight line are likely to be small. The lines tell you something in those cases, and what they tell you is quite accurate.
I’ve already explained why that’s false, but I’d be interested in hearing your counterargument.
It’s this. Not sure what else I can say.
keiths:
Alan:
First, who said anything about “exactly linear”? The criterion is, and always has been, that deviations from a straight line must be likely to be small. An exact match isn’t required.
Second, the assumption of roughly linear change is warranted in some cases, including my Tucson examples. And again, you yourself accepted my 70° F answer. That answer is based on linear interpolation, which in turn is based on the warranted assumption that the intermediate temperatures aren’t likely to deviate much from a straight line. You accepted my answer, which was based on that assumption. Now you say that the assumption was unwarranted. If so, why did you accept my answer?
Which is it? Please take some time to fight it out between yourself, and return to the conversation when your position has stabilized.
The suggestion to drop the exchange is a good one.
Alan:
Your linked comment does not address the question.
Your repeated claim is that the line tells us nothing that we didn’t already know. I provided a specific counterexample:
If you derive the equation for the straight line between those two points, you can accurately predict the temperature at 8:19. You don’t know the answer until you do the math, though. Thus the line has told you something that you didn’t already know.
Since you disagree, please point out where my reasoning goes astray.
But predictive it ain’t <ggg>
It’s your knowledge about the system dynamics that supports using linear interpolation, not the existence of the line.
Yes! That’s right! Or, to put it more succinctly:
Heh.
Alan:
keiths:
Jock:
Sure it is. Armed with nothing but the polynomial, you could predict the value at every single point. And it wouldn’t even be an estimate in this case — it would be exact.
Just to forestall some possible confusion:
1. ‘Predict’ here does not mean ‘forecast’, and we haven’t been using it that way.
2. The data points are discrete, and the numbers are reported separately for each day. There is a number for November 28, but not for November 28.7 . Intermediate data points don’t exist, so there is no question of whether the polynomial predicts them accurately.
3. If you already knew all the data points, it would of course be silly to generate the polynomial, only to turn around and apply the polynomial in order to determine the data points. That’s true, but it misses the point (so to speak), which is that the polynomial alone can be used to predict the values even if you don’t already know them. You could email the polynomial to someone and they would be able, based on the polynomial alone, to determine every data point.
Of course. What’s the problem?
keiths:
Jock:
Um, no.
I’m willing to bet that you couldn’t answer my second Tucson question without doing the math:
You don’t know the answer before doing the math. You do the math, which is equivalent to deriving the equation of the line. You plug the desired time value into the equation and lo and behold, out comes the answer. You didn’t know the answer before; now you do. The line has told you something that you didn’t already know.
What do you mean “we”, paleface? LOL
Pretty clear that “we” have been discussing how to estimate unknown intermediate values. YMMV.
[Spit-take]
If it were the case that intermediate points don’t exist, then the line tells you nothing at all. It’s just extra ink (see Tufte).
Well, I find it silly, but you are the one claiming that your polynomial is “predictive”.
No.
The polynomial provides you with a way of re-creating, given any X value that you already knew, the corresponding Y value that you already knew.
If you had proposed a polynomial that approximated the data points provided, I would have agreed with you about its predictive properties. But you chose to highlight the “polynomial that fits those points exactly.”
That polynomial’s “predictive” power is famously APPALLING. Oops.
Similarly, linear interpolation is accurate to the extent that linear interpolation is accurate. The line itself adds no information; I just use ratios to figure the interpolation in my head. [“Just to forestall some possible confusion”, that doesn’t mean I am using the equation of the line.]
Below, I have graphed some data, and included straight lines between the data points.
Data are daily readings of flow rate.
Do the lines tell us anything that we did not already know?
DNA_Jock,
This sidetrack started with my remark about lines on graphs displaying results of opinion poll sampling being decorative rather than informative.
At least variables like outputs from pressure and temperature sensors can be recorded continuously since the invention of chart recorders.
Sampling opinions seems a mite different.
ETA discrete vs continuous sampling?
Jock:
I’m referring to Alan and me, of course. As I said, we haven’t been using ‘predict’ to mean ‘forecast’. Have you read the discussion?
That’s obviously what we’ve been doing in the case of my Tucson examples. It’s also obviously not what we’ve been doing in the case of the visitor data, where there are no intermediate values.
Jock, quoting me:
Jock:
You are misrepresenting me. I can’t say for sure whether it’s deliberate or just due to poor reading comprehension, but either way it’s impeding the discussion.
Here is that quote, in context:
The context makes it obvious that I am referring to the visitor data graph, in which there are no intermediate values. Please do better, Jock.
Jock, quoting me:
Jock:
It is predictive, as I explained in the part of my quote that you chose to omit:
Jock, quoting me:
Jock:
You’re misrepresenting me again.
Just for fun, I surveyed the thread for all instances where I used those words, or similar words, to express that idea. Here they are:
1. “Does the line tell us anything? Absolutely.”
2. “The line tells you something.”
3. “The line tells you something.” (2nd occurrence)
4. “Does the line tell you anything? Yes, obviously.”
5. “The line definitely tells us something.”
6. “The lines tell you something in those cases, and what they tell you is quite accurate.”
7. “Thus the line has told you something that you didn’t already know.”
8. “The line has told you something that you didn’t already know.”
In every one of those instances, I am referring directly and obviously to one or both of the original Tucson scenarios. In none of those instances am I referring to the polynomial case.
You crack me up, Jock. I have to say, the repeated misrepresentations are more amusing than annoying at this point, but they’ll get old pretty quickly. Do you think maybe you could do better?
Jock:
So a prediction that is only approximately correct is a prediction, but a prediction that is exactly correct, with zero error, isn’t a prediction? Perfect predictions are impossible?
That polynomial predicts every point exactly, with no error. You characterize that performance as “APPALLING”. I do not think that word means what you think it means. (Not even in all caps.)
Heh. Here’s how I put it to Alan:
Do you disagree about the equivalence? If so, why?
Did you do your homework? Are the readings instantaneous or cumulative? Is the flow continuous or intermittent? Is there reason to believe that the flow rates will change approximately linearly between samples, or not?
You have to be smart about it. If you proceed stupidly, either by nature or by choice, you’re likely to get inaccurate estimates.
Jock,
Here’s a simple question. If linear interpolation doesn’t tell us anything, then why do people do it? Why do we teach it to students?
If you try to argue that linear interpolation doesn’t involve lines, I will LMAO.
Like I said, linear interpolation is accurate to the extent that linear interpolation is accurate. And it often is, hence the schoolwork. When it is, you can use a line as a form of graphic calculator, to estimate intermediate values. Never been any dispute about that. But the line doesn’t tell you anything that you didn’t already know.
We were discussing the ability to estimate values that you did not already know. I apologize for assuming that you were familiar with “overfitting”. Please look it up, then re-read the thread.
That’s right! The lines I drew don’t tell you anything that you didn’t already know!
Here’s the semi-daily data:
Fish. Barrel.
Jock,
Wow. I find it hard to believe that you’re actually choosing to dig your hole deeper, but there it is.
Jock:
keiths:
Jock:
Huh? That doesn’t follow from anything I wrote.
The questions I posed were aimed at figuring out whether linear interpolation was appropriate for your specific example. If yes, then the lines would tell you something you didn’t already know. If no, then the lines would likely tell you something false or inaccurate.
Again, you have to be smart about it. If you determine (intelligently) that linear interpolation is appropriate for the case at hand, and you proceed to apply it, then the lines will tell you something that you didn’t already know. They will provide estimates of the intermediate data values, which is the entire point of the exercise.
There is a reason people use linear interpolation. It’s because the lines tell them things that they don’t already know. If the lines didn’t tell them anything new, then linear interpolation would be pointless.
keiths:
Jock:
Let’s recap. Alan wrote this:
(I’ve attached Alan’s graph below for convenience.)
I pointed out that not only was a predictive model available for those points, a perfect predictive model was available. All you need is a polynomial that passes through all of the points. (There are infinitely many polynomials to choose from, in fact.) Such a polynomial predicts every single point in the graph. Someone who didn’t know a single point on that graph could, if equipped with the polynomial, determine the values of all of the unknown points. That’s perfect predictive power. You characterize it as “APPALLING”. Time for a rethink.
What does overfitting have to do with it? Alan explicitly referred to the points in his example, and he supplied the graph below. The polynomial predicts every one of those points with no error. No overfitting. Overfitting would only come into the picture if you were talking about points that are not part of his example.
keiths:
Jock:
You’re oh so close.
Lines can be represented mathematically as well as graphically. Google ‘analytic geometry’ for more on this. The word ‘graphic’ can therefore be deleted from your statement, leaving this:
Sounds an awful lot like using a line to tell us something we don’t already know, doesn’t it? LMAO
I’ve noticed something interesting. The letters ‘line’ appear, in that order, in both ‘line’ and ‘linear’. Freaky, isn’t it? It almost makes you think that linear interpolation might somehow involve lines. But of course that can’t be the case, since an interpolated line can’t tell us anything that we don’t already know. You and Alan have established that, and who are the rest of us to argue?
The entire point of linear interpolation is that we can estimate intermediate values using a line that is drawn, either graphically or mathematically, through two known points. Linear interpolation depends on lines; hence the appearance of the letters ‘line’ in both words. The line is essential. Whether graphical or mathematical, the line is what yields the estimates. Without the line, we lack the estimates. The line tells us something that we don’t already know. It couldn’t be more obvious.
Well, I said, “I do question whether trends can be inferred from snapshot polls and whether lines from point A to point B – straight or otherwise – tell us anything.”
And I don’t see anything from Keiths that answers my question.
Alan:
Nothing except my comments. Take a look at those.
I confess this is not obvious to me. Consider a sine wave. Draw a line from the point where the wave crosses the axis, to another point where it crosses the axis. Now, use that line to predict any point on the wave. You will most likely be wildly wrong, especially as the amplitude increases. I suppose you could argue that your prediction isn’t something you already knew, but it’s not predictive for nearly all the points on the sine wave. It will produce really lousy estimates.
But if we were to take a trend which changes linearly with time, then our linear regression would be quite accurate. Unfortunately, it would be accurate only because we applied a straight line to a trend we already knew to be linear, or which just happened to be linear even if we didn’t know that.
As one of countless examples, let’s say we wanted to estimate the global human population in the year 1850, and we picked the two points 1700 and 2020 to draw the line. Would you consider your 1850 point a good approximation?
Flint:
We covered that earlier in the thread. It’s a mistake to apply linear interpolation unless you have reason to believe that the trend is linear.
I’m not sure why you consider that unfortunate. That’s exactly how linear interpolation is supposed to work! There’s nothing magical about it. It just amounts to saying “I have data points X and Y, and I’d like to know the value at intermediate point Z. I expect the values to change in a roughly linear fashion, so let’s construct a line (graphically or mathematically) between X and Y, determine the line’s value at Z, and use that as an estimate of the true value at Z.”
I agree. In the case of UK census returns for 2011 and 2021, there are two numerical values for percentage of respondents who declared “no religion”, separated by a time interval of ten years. The arithmetic to produce a guesstimate/prediction for some intermediate time or an extrapolation to some future time is trivial. But the exercise tells us nothing new. 38 – 25 = 13 ÷2 = 6.5, so for 2016 we model 31.5% as would have declared “no religion”.
Actually, how fluid peoples’ views and opinions are in the context of events is an interesting question, to me at least. Especially with regard to Brexit but also with regard to Scottish devolution, where UK government is refusing another referendum on the question.
Alan:
It’s amazing to me that you can’t (or won’t) see the contradictions within that single paragraph.
Alan:
In writing that, you are acknowledging the need to perform arithmetic in order to produce an estimate. (Whether the math is ‘trivial’ or not is irrelevant.) You even reinforce that point by supplying the actual math you used to generate your estimate:
Yet you also say:
Let me get this straight. You started out not having an estimate. You went through the exercise in order to produce an estimate. Afterwards, you had an estimate. The exercise told you something new. Yet, according to you, the exercise told you nothing new.
The exercise told you something new, and it told you nothing new. Do you begin to sense a contradiction here?
If going through the exercise didn’t tell you anything new, then why did you bother? Why did you waste your time doing the exercise and spelling it out for us if it was all for naught?
Since you did provide us with an answer, but the exercise told you nothing new, you must have known the answer before performing the calculation. How did you magically acquire the answer to that linear interpolation problem without, you know, doing the linear interpolation?
If the exercise of doing a linear interpolation yields no new information, then why do mathematicians, scientists, and students all over the world use linear interpolation in their work? Are they all idiots?
The answer is simple. They go through the exercise because it tells them something new. You went through the exercise because you knew, just like everyone else, that it would tell you something new. You knew that it would yield an estimate for the year 2006.
You can’t have it both ways. If doing the math produces an answer that you don’t already know, then it has told you something new.
Isn’t that obvious?
No. I did some arithmetic. It provided no new data. All I have are two data points. What a 2016 census result would have been is not known, and cannot now be known. Guessing it would have been a value mid-way is not unreasonable but is still a guess.
Also, whereas some data can be continuously monitored and recorded against time (such as temperature and pressure) solicited opinions by snapshot cannot. The numbers in polls and census returns are affected by changes in demography, current events (paedophilia reports etc etc) and there’s no reason to assume a straight-line continuum. And no way to check against data as that has not been collected.
This reminds me of Uncommon Descent and denizen Kairosfocus insisting arithmetical manipulation of numbers (logs to base 2 frinstance) elicited information from data.
Dude, you are trying to defend the indefensible. What’s the point of that? It’s entertaining, but what’s in it for you?
keiths:
Alan:
Your attempted goalpost shift is noted. No one has claimed that linear interpolation produces an actual new data point. What it produces is an estimate of the value of a missing data point.
The dispute all along has been over whether interpolation (or the line employed by interpolation) tells you anything new, not whether it yields an actual new data point. And of course it does tell you something new.
You start out lacking the estimate. You perform the interpolation, which produces the estimate. You now have the estimate. Interpolation has told you something new.
Alan:
So anyone applying linear interpolation to the following poll data is being unreasonable?
Which is untestable (and not new)
keiths:
Alan:
Isn’t it obvious that linear interpolation produces an estimate? What was the result of the calculation you performed above, if not an estimate?
Alan:
Kairosfocus’s mistake was in thinking that the logarithm revealed something that wasn’t already implicit in the data. My claim is quite different. I am saying that the interpolation tells you something new despite it’s being implicit in the data.
Let’s use the logarithm as an example. Quick, what’s the natural logarithm of 572? You don’t know, do you? Now open up a calculator app and perform the operation. If it isn’t buggy, the app will give you an answer of approximately 6.349. You didn’t know the answer before; now you do. The simple act of taking a logarithm has told you something that you didn’t already know. The answer was implicit in the number 572, but you didn’t actually know the answer until you went through the exercise of taking the logarithm.
As with logarithms, so with linear interpolation.
Here is where communication is breaking down. Where did this “reason to believe” come from? If your belief is correct, you don’t need a linear regression to prove it. If it’s wrong, your regression line is useless. So the “reason to believe” is based on information you already have (and your line tells you nothing new) or it’s a completely uninformed guess, which means your line is as well.
A regression line is good for three things: to tell you if the actual data is more nearly linear than some other curve; to tell you a slope to give the magnitude and direction of a trend; and to give you a correlation coefficient (linear regression of random data tells you nothing useful.) But all these uses start with actual measurements. You can’t work backwards from the line to the measurements, you simply lack the data to do so.
Egad! At least this example illustrates your problem. The answer WAS already known. Taking the log didn’t give you any new information, it simply informed you of information already calculated for you. I think what’s happening here is, I’m thinking of “unknown” as being not known to anyone, while you think of it as simply something YOU don’t know, even if it’s known to others.
If a data point is truly unknown (to anyone), and IF that data point is on or near a straight line, THEN the line might provide a hint of where to look for the data, what measurement to take. So you go measure, and if you’re not even close you have a hint that your trend is not linear. But without the actual measurement, and without foreknowledge that the trend is linear, you are hoping and guessing.
Flint:
I see the problem. You are confusing linear regression with linear interpolation, but they aren’t the same. The point of contention (or rather, a point of contention) in this thread has involved linear interpolation, not linear regression.
Take another look at the description I gave you yesterday:
In linear interpolation, you are connecting two points with a straight line and using that line to estimate intermediate values. No other points are involved. This isn’t a form of curve fitting.
You won’t get accurate estimates unless the actual trend between the points is roughly linear. Hence my statement:
Flint:
The problem is that you didn’t read for comprehension. More on this below.
You quoted me without comprehending what I wrote. Here’s the quote:
It is obvious, particularly in context, that the word ‘you’ in that quote refers to Alan. You somehow interpreted the phrase ‘you didn’t actually know the answer’ as ‘the answer was unknown to anyone’, but of course it doesn’t mean that at all. What I wrote is what I meant.
With that in mind, consider the following classroom scenario:
When the teacher called on you, you didn’t know the answer. After you ran the calculation, you knew the answer. The calculation told you something that you didn’t already know.
Thus, there is no reason for you to disagree with what I wrote:
I think the crux, as you say, is between measurement and calculation. We can observe and measure physical phenomena. Some phenomena are amenable to continuos monitoring: air temperature, system pressure in a water supply network, sea level. Sea level variation is a sum of cyclical and chaotic elements (tidal effects both long and short term, weather, shifting equilibrium between ice and water etc), yet analysis of the data can allow useful predictions. Trends can be extrapolated. Peaks can be anticipated. Designs can incorporate expectations of flow requirements and pressure variation.
Data from elections, census returns and sampling by opinion polls are not continuous. Like stock prices (another form of opinion), they are inherently chaotic and much influenced by events. (Twitter, Tesla, Musk). A crystal ball is as accurate as any mathematical model for predicting trends in opinion.
Keiths seems to concede with his logarithm example. The relationship between a number and its logarithm is fixed. When I was at school, I didn’t need to remember what the logarithm to base 10 was. I only needed to remember where to find my log tables booklet. You an even use mental arithmetic.
Are the results of number manipulations invented or discovered? Are the (correct) answers new if they are always the same?