
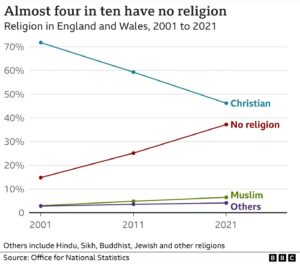
Results from the decennial census show that for the first time ever, fewer than half of English and Welsh citizens identify as Christian. The decline has been precipitous, as shown by the graph.
It appears that most of the Christians jumping ship end up in the ‘no religion’ category rather than converting to another religion. No data on how many of them still believe in a god or gods, or in a ‘higher power’. Also interesting that if established trends continue, the ‘no religion’ folks will become a majority in the not very distant future.
The graph comes from this BBC article.
I suspect we can get no further here. I would interpret you as saying that IF a trend is linear and IF we draw a straight line between two points on that trend, THEN we can use that line to approximate (take an educated guess at) the actual value at some point along our line. Which we would do if we had no other clues about that value, and no practical way to actually measure it. My experience tells me few relationships in the real world are linear. I suppose if the two points chosen are very close together, then some point between them would be a good guess most of the time.
Your example with the logs is unhelpful, because it does NOT provide an approximation to an unknown value. That log is a KNOWN VALUE, so there is no need to presume some curve shape to guide an approximation, no need to approximate something you can simply look up, as opposed to going out and performing a unique measurement.
I learn quite a bit every day that’s new to me without the need to go out and do original research. Google is my friend, but it also tells me my ignorance is vast. Nonetheless, it suggests how much IS known, even if not by me.
🙂 Google was very helpful to me just now in finding out how mean sea level is measured.
Alan:
Let me see if I can unravel some of the confusion here.
First, the ‘interpolation doesn’t tell you anything new’ dispute is about interpolation, not extrapolation, so observations about extrapolation are extraneous to that dispute. Second, whether phenomena are amenable to continuous monitoring is distinct from whether they actually are continuously monitored, and even if they are continuously monitored, they may be sampled discretely for purposes of analysis. (They are likely to be sampled discretely, in fact, because data is typically stored in digital form and it would require an infinite number of samples to perfectly represent a continuous waveform.) Third, whether data is continuous or discrete has nothing to do with whether the phenomenon in question is chaotic or “much influenced by events”, or whether “trends can be extrapolated” or “peaks can be anticipated”. Fourth, interpolation isn’t even an issue if you actually have a continuous waveform (as on a paper seismogram, for example), because there are no missing data points in that case. Fifth, your “crystal ball” claim is clearly false, as you should know since I have already shown you a striking example (which I have again attached below) of a case where a mathematical model is far superior to a crystal ball at indicating the trend.
Flint:
Why the pessimism? You disagreed with my statement because you misinterpreted the phrase ‘you didn’t actually know the answer’ as meaning ‘the answer was unknown to anyone’. Now that you’re aware of your mistake, it should be possible, I would think, for you to agree with what I wrote:
Flint:
Not quite. The overall trend doesn’t have to be linear; it just needs to be roughly linear, and only within the interval of interpolation. It can be nonlinear elsewhere, and the definition of ‘roughly’ will vary depending on the size of the errors you can tolerate. With those caveats in mind, yes — linear interpolation is a technique for using a line between two known data points to estimate the value of an intermediate point when we have reason to believe that the trend between the points is roughly linear.
Which is often the case. We would also use linear interpolation under other circumstances, for example if we needed an estimate quickly and an actual intermediate measurement, while possible, would take too long.
They only need to be roughly linear and only within the interval of interpolation, as explained above.
Decreasing the distance between the points can be a way to reduce errors caused by nonlinearity. However, that doesn’t necessarily mean that the points need to be close together. The more linear the trend, the farther apart the points can be while still maintaining an acceptable accuracy.
Bottom line: linear interpolation is a useful tool which does exactly what it is designed to do, provided that it is applied correctly. That is why it is so widely used and taught.
Flint:
You’re misunderstanding the point of my analogy, so let me clarify.
Performing a linear interpolation is a calculation, and so is computing a logarithm. In both cases the result of the calculation is implicit in the inputs. However, the fact that the answer is implicit does not mean that the answer is known by the person doing the interpolation or computing the logarithm. That’s precisely why they perform the calculation — they want to know the answer and they understand that doing the calculation is the way to obtain that answer. The calculation tells them something that they didn’t already know.
If it didn’t, why would they bother with the calculation?
You probably made the mistake of looking at this graph and inferring a trend toward more tolerance of same-sex marriage. I know I did.
What idiots we are. As Alan keeps telling us, you can’t infer trends from polling data.
Never said that.
Yeah, that’s probably the explanation, but it might just be that people are more easily affected by ‘framing’ than they used to be. That footnote “…polls in which same-sex marriage question followed questions on gay/lesbian rights and relations” is problematic for anyone who understands polling.
keiths:
Alan:
Heh. I had to go back a grand total of four comments to retrieve this:
Jock:
I’m pretty sure you’ll agree that the fact that preceding questions were about gay/lesbian rights does not by itself invalidate the answers to the legality question, any more than a question about the economy necessarily invalidates the responses to subsequent questions on the same topic. I’ll grant that if a preceding question had been something like “Do you approve of the evil people who support same-sex marriage?”, then the answers to the legality question might be skewed. (I’m not implying that the issue is always that unsubtle; just using a vivid example.) But the Gallup people have been in this business for a long time, and they are not stupid. They know a thing or two about framing questions properly.
Also, we’re not concerned with the absolute numbers here. We’re talking about trends, and a trend can be inferred even if the numbers are skewed slightly by framing effects.
Imagine what would be required in order for framing to trick us into a false inference here. First, the effect would have to be huge. The end-to-end delta for the “should be valid” line is a whopping 44%. Next, and even less probably, the framing effect would have to systematically vary year over year in a way that would fit the false trend line. It would be a miracle if the Gallup people, while trying to avoid framing effects, nevertheless managed to create effects so huge and so systematic. It’s completely implausible.
Finally, the inference isn’t based on a single poll. Are you aware of any reputable polling organization claiming that the trend doesn’t exist? What are the odds that all of these organizations have been afflicted by the same huge and systematic framing effects needed in order to induce a false inference? It ain’t possible.
Can we infer trends from polling data? Yes, absolutely. Can we infer, based on polling data, that approval for same-sex marriage in the US has increased steadily over time? Absolutely and obviously. It’s a slam dunk.
Alan’s statement is ridiculous:
Now I’m confused. I (and I think Alan as well) aren’t saying you can’t infer trends from measurements (and polls are measurements). We are saying that the reverse is not necessarily true, that it’s at least risky to try to infer hypothetical measurements from trends. Jock even presented graphical data showing that the effort to infer data from presumed but untested trends can often be wildly wrong.
Alan’s statement isn’t ridiculous, it’s accurate. He’s saying that chaotic data make for lousy straight lines, and imposing a straight line on chaotic data and interpolating to approximate values is useless. Interpolating works fine IFF the underlying data are a close fit to linear, but you don’t KNOW this until you start taking measurements. You cannot validate an assumption (of linearity) simply by requiring linearity and assuming it to be the case. You are using your assumptions as your predicates, to prove the correctness of your assumptions. A clear illustration of circular reasoning.
Flint:
Alan is saying that. Refer to the very last comment of mine, the one that you just quoted. Alan wrote:
Trends can be inferred from polls, as you and I have both affirmed. Alan is wrong to doubt that.
Flint:
You have to be smart about it. I have made that point repeatedly in this thread.
I don’t understand why you didn’t read my response to Jock. I wrote:
And:
Flint:
It’s ridiculous. Look at it again:
Regarding his first point, you yourself just affirmed that trends can be inferred from polls (and I agree, of course). Regarding his second point, the lines constructed during linear interpolation obviously tell us something. If they didn’t, we wouldn’t bother constructing them in the first place.
I can’t force you to read and comprehend Alan’s words, and mine, but I humbly request that you do so. Otherwise, what’s the point of having a discussion?
Flint:
Take a look at what he wrote:
Polling data is not “inherently chaotic”. Sometimes it’s chaotic, but often it isn’t. The New Zealand data below is not chaotic, and it shows that contra Alan, a mathematical model can far outperform a crystal ball in predicting trends in opinion.
Not quite. Measurement is one way of supporting the assumption that the underlying trend is close to linear, but it’s not the only way. Suppose we are filling a cylindrical bucket using a hose with a constant flow rate. Without doing a single measurement, we can confidently state that the water level will rise in a linear fashion, and we can use that knowledge to justify the use of linear interpolation.
Obviously.
There’s no circularity. In the case of the bucket, the assumption of linearity is justified by the mechanics of the situation. In the case of the polling data, the assumption of linearity is justified by the data points we already have plus the lack of a reason to expect any significant departures from linearity.
Look at the New Zealand data. There is no data point for 1998, but we are clearly justified in using linear interpolation to produce an estimate for that year.
Yes, my original remark was just an aside directed at visual presentations in the popular press at the pointless (heh) practice of putting lines on diagrams that add no information but are merely there to look pretty.
Regarding the UK census returns, the only information we have is the sum of responses to questions ten years apart. Of course we can infer what we like about how opinion may have varied in the interim but drawing a straight is trivial.
“Constant flow rate”. That’s data. Unless you made an assumption. Not sure we can extend that assumption to the opinions that people express over time.
Yes, obviously.
keiths:
Flint:
Alan:
Nice try at deflection, but the statement we were referring to was the one I quoted:
There is no reason to question either of those things, and I’ve repeatedly explained why. Trends can obviously be inferred from polling data and the lines used in linear interpolation obviously tell us something.
You’re coming very close to finally acknowledging and correcting your mistake. Let’s make it explicit. Do you agree, finally, that trends can be inferred from polling data? Do you agree, finally, that the lines constructed during linear interpolation tell us something?
Alan:
It’s information about the setup, but it isn’t a data point. A data point would be a pair consisting of a time and a water level. We have none of those (yet).
The following are all part of the information we have about the setup: the constant flow rate; the bucket’s cylindrical shape; the fact that the bucket is on the surface on the earth and not orbiting on the ISS; the fact that the bucket is solid and isn’t made of steel mesh; the fact that the liquid is water and not super cold nitrogen; and so on. The information we have allows us to establish the linearity of the process, thus justifying the use of linear interpolation. All without taking a single measurement.
Note that we aren’t in a position to analytically generate any data points. Why? Because we don’t know the flow rate, though we know that it’s constant; we don’t know the diameter of the bucket, though we know that it’s cylindrical; and we don’t know how much water is already in the bucket.
We have to take measurements, and once we’ve acquired a couple of data points, we can use linear interpolation to estimate intermediate values.
Flint:
keiths:
Alan:
I’m glad we agree, but are you trying to make some larger point?
Of course not. I never said otherwise. I’ve no idea how you inferred anything else.
No. The data are the information. Joining points with a straight line provides no extra information, particularly in the case of historical snapshots where confirming data cannot be retrieved. If course you or anyone can predict the trend of future belief by extrapolating from previous data points. A consistently rising or falling trend can be inferred from the data points. And the only way to confirm such predictions is by taking another poll. It’s an informed guess without more data, whether you draw lines or not.
No idea why you’re telling me this. You ignored my example of temperature against time of water cooling in a beaker.
Information in my book is synonymous with data (something given). If you prefer to call some facts you have “data” and others “information”, carry on.
I note that the near-unanimous prediction of a blue wave in 2020 fell far short of all those predictions. The common prediction of a red wave, based on all those polls, bombed in 2022. Today I note that Trump is blasting one poll that had him 25 points behind Desantis, and citing another poll that had him 25 points AHEAD of Desantis, though the polls were taken the same way over the same period. Which of those two polls should we take as our baseline?
There does seem to be a relationship between poll results and who does (and pays for) the polling. But under no linear model can those two polls Trump cites fall on the same straight line.
Be serious. The constant flow rate is known in advance, and it is that knowledge which permits a straight line model. If you had no knowledge of what the flow rate might be (for example, using rainfall instead of a hose, or having some child playing with the faucet), your line would be worthless. Sure, you can say “well, it’s not children or rainfall” but that simply admits that your ability to predict data based on interpolation requires that you already know the data making up the line you’re using to interpolate.
However you choose to smuggle in the necessary information, your interpolation simply does not tell you anything you don’t already know.
keiths:
Alan:
Alan, a few sentences later:
TSZ sure is entertaining sometimes.
Alan:
keiths:
Alan:
There’s a phenomenon known in the lingo as “discussion”. You addressed a statement to me, and I did something that’s known as “responding”.
If “ignored” means “responded to”, then yes, I ignored your example. Link
Call it whatever you want. I’m comfortable with the idea that ‘information’ is roughly synonymous with ‘data’. There is nevertheless a major difference between a piece of information about the setup (in this case, the knowledge that the flow rate is constant) and a data point, which is something that can actually be plotted on the graph of water level vs time. I am hoping to forestall confusion by stressing this. Do you see the difference?
Now back to your statement. Let’s grant that information is roughly synonymous with data. How does that help your case?
Flint:
I’m struggling to understand the point you’re trying to make here. Two particular polls taken at almost exactly the same time gave disparate results. That would imply that at least one of the polls is inaccurate, and it’s even possible that both of them are. Therefore…? Is your point simply that poorly designed polls can lead to false inferences? If so, who in this thread has ever claimed otherwise? If that isn’t your point, then what is?
Also, I don’t see why anyone would even try to plot those results on a straight line, since the polls were taken at almost exactly the same time.
You told us yesterday that you don’t deny that trends can be inferred from polling data. Given that, what conclusion are you asking us to draw from the conflicting Trump polls?
Exactly! Please, please hold that thought! The constant flow rate is one of the pieces of knowledge (among others I have listed and some I have not) that justify the assumption of linearity.
Let’s revisit our exchange. You wrote:
I responded:
You will eventually be measuring water level vs time and plotting those points, but you can infer linearity from the setup before doing a single one of those measurements. It’s exactly as you noted above: the constant flow rate is (one of the reasons) why an assumption of linearity is justified.
Flint:
Here’s a counterexample I used earlier in the thread, before you joined the discussion. You are in Tucson on a clear, calm day. It’s after sunset and the temperature is dropping. The reading at 8:03 is 73.8° F; the reading at 8:56 is 67.9° F. What’s the estimated temperature at 8:19? Don’t reach for pen and paper or a calculator. According to you, the interpolation can’t tell you anything that you don’t already know. Since you already know the answer, what is it, off the top of your head?
Cat got your tongue? The simple and obvious fact is that you don’t know the answer until after you’ve done the interpolation. The interpolation tells you something that you didn’t already know.
If it didn’t, why would scientists and mathematicians all over the world use linear interpolation? Why would they bother with a calculation that told them absolutely nothing that they didn’t already know?
Flint:
In my example, we can justify linear interpolation without knowing any of the data making up the line. As I pointed out to Alan:
Consideration of the setup tells us that the trend will be linear, but we have no way (yet) of determining or predicting any of the values. We need a couple of measurements first. Then we can draw the line and use it to predict intermediate values.
https://en.m.wikipedia.org/wiki/C._Wright_Mills
https://en.m.wikipedia.org/wiki/Social_network_analysis
What to say to the kids when they ask
You remind me that there are many non religious but sacrosanct and contrafactual beliefs out there.
Seems one religious contrafactual belief is on the rise.
Paganism!
petrushka, to Alan:
Like the belief that the 2020 presidential election was stolen.
I made a Fisher Pry model ages back using Pew data and estimated America would be majority irreligious after 2042
Hi, Rich! Nice to bump into you.
Pew’s own projections (see below) are less optimistic than your Fisher-Pry model’s. Even in their most aggressive scenario, Pew doesn’t predict that the Nones will hit 50% until around 2070.
I know that the Nones include a significant number of people who remain theists despite disaffiliating themselves from organized religion. Would you expect Fisher-Pry to work better if applied not to the Nones as a whole, but rather to the ones who don’t believe in God?
Pew finds that 30% of Americans fall into the ‘None’ category, and the Gallup data below shows that 81% of us believe in God. If those numbers are correct, it follows that at least 11% of us are Nones who believe in God, which is about 1/3 of the total Nones.
New Guardian article:
Losing their religion: why US churches are on the decline
“As the US adjusts to an increasingly non-religious population, thousands of churches are closing each year – probably accelerated by Covid”
Fun fact: The REM song “Losing My Religion” isn’t actually about Michael Stipe losing his religion (though he knew people would take it that way and rolled with it). “Losing my religion” is actually a Southern expression meaning “at my wit’s end”.
A series of Associated Press articles on “The Nones” in the US, Italy, South America, Nigeria, India, the Middle East, Israel, and Japan:
The Nones