
Lizzie Allan Miller said:
Here’s a simple experiment one can actually try. Take a bag of M&M’s, and without peeking reach in and grab one. Eat it. Then grab another and return it to the bag with another one, from a separate bag, of the same colour. Give it a shake. I guarantee (and if you tell me how big your bag is I’ll have a bet on how long it’ll take) that your bag will end up containing only one colour. Every time. I can’t tell you which colour it will be, but fixation will happen.
I’ve written an interactive browser based version you can explore this idea with.
http://mandmcounter.appspot.com/emeniem.html
You can change the bag size, number of colors, speed of each round and graph the results, as well as see in real time the number of each color that remains and watch the end-game in detail.
You start with a bag size of 1950, containing 150 colors. Click reset to rerun the simulation with the same parameters, or change them and it automatically restarts with the new parameters.
You’ll probably need a relatively up to date browser.
Some explanations, from top to bottom. But just go press the buttons, that’ll make more sense 🙂
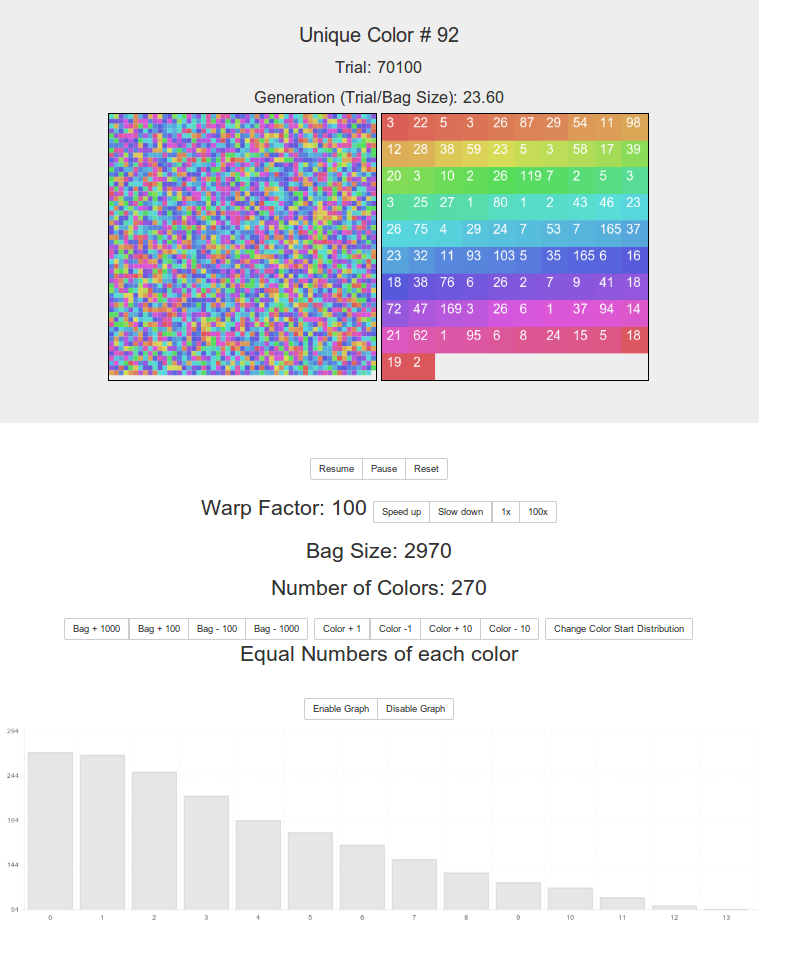
Unique Color # is the number of colors that remain in the bag. This updates in real time.
The trial number is how many times we’ve reached into the bag, ate one, picked one and replaced two.
The generation is the number of trials divided by the bag size. Fairly arbitrary.
The two squares show, on the left, a representation of the bag. Items are removed and inserted at random places. On the right are the colors in the bag and superimposed on them are the numbers of those colors in the bag.
You can resume, pause and reset the simulation. Reset uses the current values and generates a new random bag.
Warp factor is how many trials are run between each update of the screen. The default is one, so “real time”. Increase and decrease that with the buttons as you like.
Bag size is the bag size you ended up with after some constraints relating to number of colors were satisfied (if you want equal numbers of colors the bag size has to be a multiple of that). There may be some faulty logic here!
The number of colors is, well, the number of colors you’ve set to be in the bag. It’s actually the range of possible colors that the bag can choose from so sometimes you might end up with fewer in the bag at the start of a round then you set in the “unequal number of colors mode”. But bigger bags will of course usually use up all possible colors. And equal color mode (the default) always starts with all colors in the bag.
You can change the size of the bag, subject to some lower limits (e.g. the number of colors) and the number of colors can also be changed, up to 350 currently.
Clicking “change color start distribution” sets either equal numbers of colors at the start of the round (so no one color will obviously ‘win’ due to a starting advantage) and random numbers of each color at the start. The default is to have equal numbers.
You may find some weirdness with very large bag sizes.
Finally the graph shows a count of colors over time, if you change the warp factor the timing of the graph does not update accordingly however (I had to finish this up!). So change the warp speed then click reset and the graph will be ok for that round.
I’ll add a “add a single black one” button in the next couple of days, but in the meanwhile just pick a color and root for that!
So I hope this is useful/interesting/whatever, and if you have feature requests, bugs, questions or ideas for further such toys please feel free to note them as a comment in this thread.
Please keep comments regarding the original discussion etc to the relevant threads, not this one.
Well done, Sir.
It’s hypnotic!
So why is this not an analogy that demonstrates the ID claim how information is always lost?
/devils advocate
ETA to correct “HTML” error
Nice toy! You can observe how colors get eliminated as time goes on. Be sure to speed up the visualization (x1000) if you run the default size, N=1950.
Lovely, always like to play around with these things.
Can you introduce a mutation option such that new colours spontaneously arise, with an option to set the mutation frequency?
Started with N=1950 M&Ms and 150 colors (default starting configuration). After 500 generations, down to just three colors.
After 700 generations, two colors, roughly equally represented. Now it’s a random walk on a line of length N. It should take of order N^2 steps to reach the edge and get rid of one of the colors. That is, N generations.
Actually it was Allan Miller!
What did you code this in? It doesn’t display on either Safari or Firefox under OS X Mavericks.
Works for me in Chrome on OS 10.6.
Depressing. It’s written in Dart, https://www.dartlang.org/ and compiles to JS so should run ok on most things but as yet only really tried in Linux Chrome/Firefox. I’ve just tweaked the files a bit, and put something back that did not seem to be needed (by me!) so perhaps it’ll work now (but doubt it).
I think I can do that, yes 🙂 I will wait a few days so I can get any other requests in the next version at the same time.
Looks like I accidentally requested deletion of my previous comment, cancel that.
After 2231 generations, the population (N=1950) is single color.
Rumraket,
Reinstated.
This was a bit too enigmatic for me but the penny’s just dropped.
@ OM
Your quote attributed to Lizzie in the OP is actually by Allan Miller.
Cool, I’ll muck around with Dart and see if there are any known problems. Mavericks hasn’t been the smoothest upgrade.
That is very cool, thanks!
So this program is designed to show how over time, through evolution, you will get less and less diversity?
Allan Miller,
“The generation is the number of trials divided by the bag size. Fairly arbitrary.”
What is the reasoning behind this definition?
No. It is demonstrating the phenomenon of drift where an allele can move to fixation purely randomly. Mutation, which continually feeds new alleles into gene pools, is not part of this model.
Again, this is why I emphasize that it be more clearly stated what each step in this process is supposed to be representing, otherwise its meaningless. What is the program designed to tell us is happening as each member of the population produces an offspring?
OMagain uses the same definition as I do. It is also equivalent to Joe’s (a child has generation number equal to that of its parent + 1), as has been explained a zillion times.
Read the OP of the previous thread, Randomness and evolution.
There are ten M&M’s in the bag. One is black the other 9 are blue. They all have one baby M&M the same as themselves, except the black M&M has two babies and one blue M&M has no babies. The original population is all dead, and we are left with their descendants, 8 blues, 2 blacks.
That is the equivalent of one generation. See One trial equals one generation.
The next round, a similar situation occurs and we have 7 blues and 3 blacks.
Thus it would take exactly ten generations (the absolute minimum) to replace the ten blues with ten blacks. But this is not neutral drift, this is of course selection of drift. In neutral drift, each generation is multiplied randomly. Thus it takes many many generations for the replacement to occur.
At some point the population may well end up 50/50. And may drift back and forth from 50/50 for many many generations. The higher the population, the longer it will take to overcome the odds of this 50/50 balance entirely into a 100% balance at one end.
In a population of four, the fastest this can occur is four generations. Not ONE generation. Four does not equal ONE!
Your definition of a generation is wrong.
Exactly. 10 individuals have been eliminated and we have 10 new individuals. 1 generation = 10 deaths.
WTF?? Now you’re so desperate to prop up your misunderstanding that you have each parent produce multiple offspring? That drastically changes the model, not that you understand or care.
What happens if the black M&M has ten babies and all the blues die childless? Then we get fixation in one generation even by your nonsensical computations. Right?
It’s OK, thorton. In this example phoodoo is off by a factor of 2 (only half of blue M&Ms get to reproduce, the rest die immediately). But at least he is right as far as orders of magnitude (powers of N) are concerned. The number of deaths in a generation scales as N in this example, which is how it should be.
The births and deaths happen at exactly the same time. You are replacing each member with a new member. Each draw is a new generation.
Thorton is still trying to figure out what M&M’s are. Don’t worry about him.
Phoodoo, you just wrote:
In your own example, we have 10 deaths in 1 generation. That’s exactly right.
1 generation in a population of N M&Ms = N deaths.
LOL! I’ll understand M&Ms long before you understand evolutionary theory or basic mathematics.
And in that one generation we have only added ONE new black. So we still have the same problem. Each of your draws is equal to ONE generation. Not equal to one tenth of a generation.
ONE draw equals ONE generation. Four draws does not equal ONE generation.
Oh dear. All this time and phoodoo still can’t grasp that reproduction in a population of size N happens in parallel, nor serially.
Phoodoo really does think that if one ship can cross the ocean in six days then ten ships will take sixty days to cross.
No. See this comment.
In this example each color is chosen at random and the changes made. Each member of the population is not iterated through and the change made, as this did not seem to be part of the original description. Rather “generation” is a description of the fact that number of changes is (plainly) some multiple of the bag size.
So here at generation 1 each color has had a chance to be a parent, not that they necessarily have been. There’s a chance that the same color was chosen over and over again. A small chance 🙂
If you can explain in sufficient detail a better way then I can include it in the next round of changes.
Them substitute “trials” for “generations” in this example. ONE draw == ONE trial.
An alternative view is that it’s a FSCO/I generator, in that the end result is very unlikely to have arisen by “chance”, which I believe is the core definition of these metrics.
Phoodoo,
There is not a single number of generations separating the start individuals from any later population. But there is a mean, and it converges on N births per generation for increasing N where N remains fixed for a given run – births and deaths cancel out.
You are partly misleading yourself by thinking about tiny populations, which are too ‘lumpy’ – individuals are a significant proportion of the whole, and deviations statistically more likely – to clearly see that convergence.
OMagain,
You could address the ‘generations’ issue by having a parameter for each member starting at zero. Every time one is duplicated, the ‘child’ gets its parental number + 1. When you want to know the mean number of generations that has elapsed, you identify each distinct number (g) and count how many others (n) have that.
Mean generations is ((n1/N) * g1) + ((n2/N) * g2) + …
A mathematician may suggest a better way.
Although it tends to be ignored at high school level, I’ve long had an idea for a classroom version of a ‘drift program’ that periodically introduces a ‘Homer’ mutation. Every time that mutation is lost, the program emits a “D’oh!”; every time fixed, a loud “Woo-hoo”! Set it off, then get on with something else and wait for Homer to announce his success among the predominant utterances of “D’oh!”.
Allan Miller,
D’oh! Or a programmer! You don’t need to identify groups and count – each member is in a group on its own, frequency 1/N. One pass is sufficient.
If ‘membergen’ is the ‘generation count’ of a population member, inherited from its parent + 1:
for each member
meangen = meangen + ((1/N) * membergen)
end for
A delightful program.
For those who want the theory underlying this, what is being simulated is a “Moran model”. That is a model of a stochastic process of population reproduction which has overlapping generations, in the simplest possible way. These models were introduced by the late P.A.P. (“Pat”) Moran, an eminent Australian probabilist, in his 1958 paper entitled “Random processes in genetics” published in the Proceedings of the Cambridge Philosophical Society. Moran is probably best known to probabilists for his work on queueing theory and a stochastic model of rainfall and dams. He has a Wikipedia page.
These models complement the Wright-Fisher model of discrete nonoverlapping generations, introduced by Sewall Wright and R.A. Fisher back around 1930. If there is genetic drift (the random reproduction) and no mutation or natural selection, the effective population size in the Moran model is N/2.
olegt is correct in analogizing the Moran model to a random walk on a line, for the case of two alleles. However, the Moran model with two alleles does not take one step up for down per unit time, If current gene frequency is p it will take one step up or one step down, each with probability p(1-p), the rest of the time taking no step.
Both Wright/Fisher and Moran models are closely approximated by diffusion processes (with adjustment for effective population size). That is, a sequence of Moran models of size N whose gene frequencies are observed, on a time scale with 1 unit per N generations, converges weakly to a diffusion process as N goes to infinity. This is the same diffusion process as for a Wright/Fisher model, once one adjusts for the effective population sizes.
The convergence to diffusion processes was known to Wright and was formally shown by William Feller in 1951. For the diffusion process approximating these models, the distribution of the time to fixation has been worked on by Warren Ewens (see for example the heavy theory in his 2004 second edition of his book Mathematical Population Genetics). If I recall correctly, there are expressions for mean fixation time, and the distribution of fixation times can be obtained numerically, but no analytical expression for it yet exists. For the Moran model or for the Wright/Fisher model, once can of course write down a transition probability matrix and get the distribution of times to fixation numerically by computing powers of it.
There is a Wikipedia page on the Moran model.
I just mention this in case phoodoo is disappointed by the low mathematical level of the discussion here, and because our friends over at Uncommon Descent are always declaring that evolutionary biologists refuse to make their arguments quantitative. 🙂
If there is no mutation and mechanism for niche formation, yes, you will get a reduction in diversity. Currently the program only simulates drift in a static environment without any novel mutations.
This helps understand some but not all aspects of drift. It has limited usability, which is why I suggested to introduce an option for random mutation earlier, to bring it closer to reality.
Let me put this example in practice. If fixation happens easily, wouldn’t the pepper moth trait be ‘fixed’ over thousands of generation ? How did the melanic trait exist if the species population was fixed ?
Couple of points, coldcoffee.
First, fixation by neutral drift is a feature of relatively small populations. A thousand generations is a fixation time in a population of a thousand. Generally, N generations in a population of N organisms. In large populations, it simply does not work as it takes too long.
Second, in Allan’s model no new mutations occur after one (or several) have been introduced at the start. If you allow for mutations to occur then fixation of one allele will not be forever. From time to time a new mutation will appear that takes over, and so on.
Ok. Got it.
That is where you have your misunderstanding. In some models, that is how it works, but in a Moran Model, each “turn” is a single reproductive event. You are not replacing each and every member, but only one mother producing one child per “turn”. Once you give each mother a chance to reproduce, then you have what could be called a generation.
Hey – cool!
(I only just got to see this, as my previous comments were from my work terminal using IE8, and the graphic didn’t show. Latest Firefox shows it up a treat).
Piggy-backing on Allan’s comment, it is now working in Safari on OS X.
So, are you going to make it run continuously with an adjustable mutation rate and outputs tracking expected vs. actual fixation?
Just to note to the several posters that have referred to mutation that the essence of the model was to illustrate loss of diversity with no new mutation. The start point was a fresh bag of M&Ms, not a bunch of mutant M&Ms. Or was it … ?
The process at work does not change when mutants are introduced (assuming they are neutral). What is being fixed is actually ancestry. If an allele mutates partway through the fixation process, the ancestor still fixes, it’s just generated more than one different versions of its allele by the time it reaches fixation.
Look at it this way. Take a starting population with no variation at all. Say it is completely ‘white’. Taking successive time slices, and operating the ‘M&M model’ upon it, we can stack these up as a series of disks, stacking into a cylinder. Even though one of the white blobs is to become the ancestor of all at any point, you can’t see it because everything is white. So now a ‘blue’ mutation occurs. It starts as a dot. It could be eliminated soon, could persist for a while, or could ultimately fix. At another generation, red appears, and somewhere else, yellow, etc.
Each of these, while it increases in number, will describe an approximate cone within the cylinder. If its fortunes reverse, the cone will invert and eventually it will be squished out. If it fixes, the cone base will be the entire population.
Now, the fresh bag of M&M’s represents a cross-section through one of these populations, subsequent to the elimination of ‘white’ but before the fixation of one of the mutants. In effect, the bag contains only mutants – variants from a prior state.
Of course the real situation is dynamic (hence the name, population dynamics). But the key feature is fixation of ancestor X, not allele X. This is the process on which, periodically, a new variant rides to fixation. If further mutation occurs – well, of course! That, too, is evolution. But without variation input, population processes eliminate variation, whether more quickly (selection) or slowly (drift alone).
(eta: to belabour the point: because nothing much can distinguish old from new, ‘eliminating variation’ periodically means chucking out the old in its entirety – fixing a new variant, ie a mutant.)
Indeed, I’ll have another version up later this week with that. I need rework a few things first, as using HSV values for both the color and ID of the individual was a bad idea 🙂 for extensibility.
I’ve also some further ideas about using “isolates” (worker-threads for the JS heads) to run multiple trials simultaneously (should allow you to max out all your CPU cores) that I want to try out as well.