
(crossposted from here and here)
(Edited Feb 2, 2016 to add eight figures)
Since 2005, Uncommon Descent (UD) – founded by William Dembski – has been the place to discuss intelligent design. Unfortunately, the moderation policy has always been one-sided (and quite arbitrary at the same time!) Since 2011, the statement “You don’t have to participate in UD” is not longer answered with gritted teeth only, but with a real alternative: Elizabeth Liddle’s The Skeptical Zone (TSZ). So, how were these two sites doing in 2015?
Number of Comments 2005 – 2015
| year | 2005 | 2006 | 2007 | 2008 | 2009 | 2010 | 2011 | 2012 | 2013 | 2014 | 2015 |
|---|---|---|---|---|---|---|---|---|---|---|---|
| UD | 8,400 | 23,000 | 22,400 | 23,100 | 41,100 | 24,800 | 41,400 | 28,400 | 42,500 | 53,700 | 53,100 |
| TSZ | – | – | – | – | – | – | 2,200 | 15,100 | 16,900 | 20,400 | 45,200 |
In 2015, there were still 17% more comments at UD than at TSZ – 53,100 to 45,200.
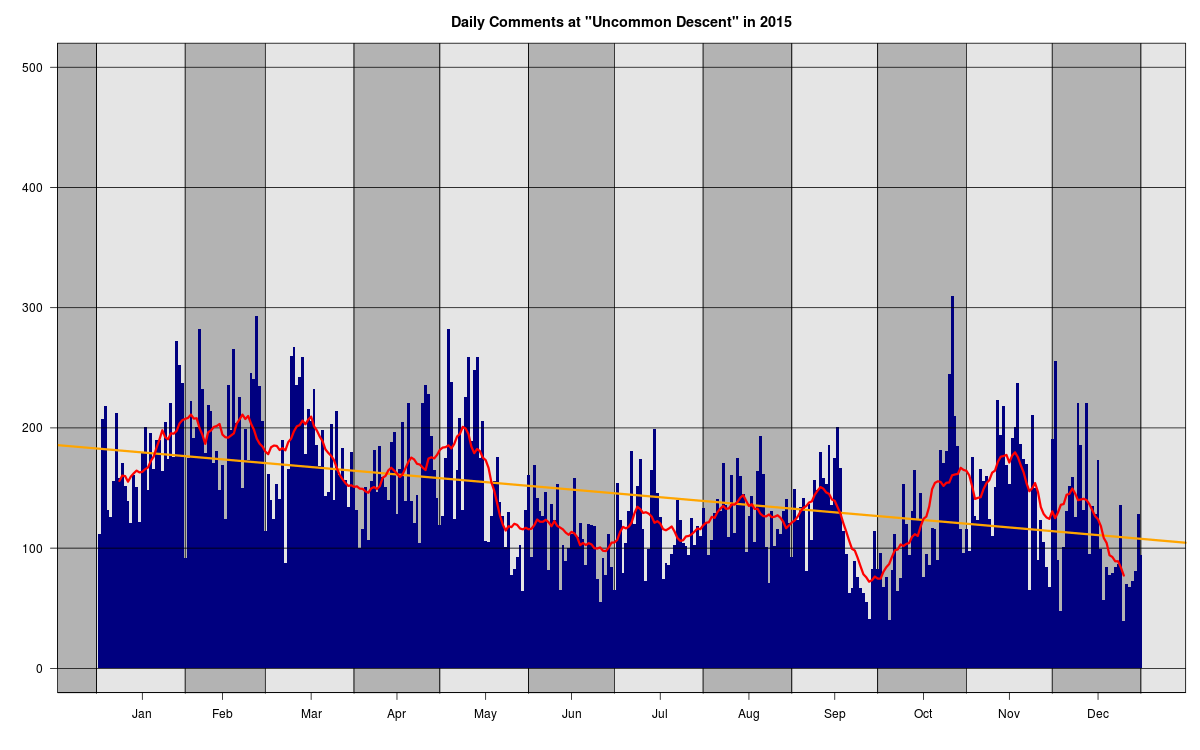
Though UD is still going strong, there is a slight downwards trend (yellow line) in the daily number of comments.
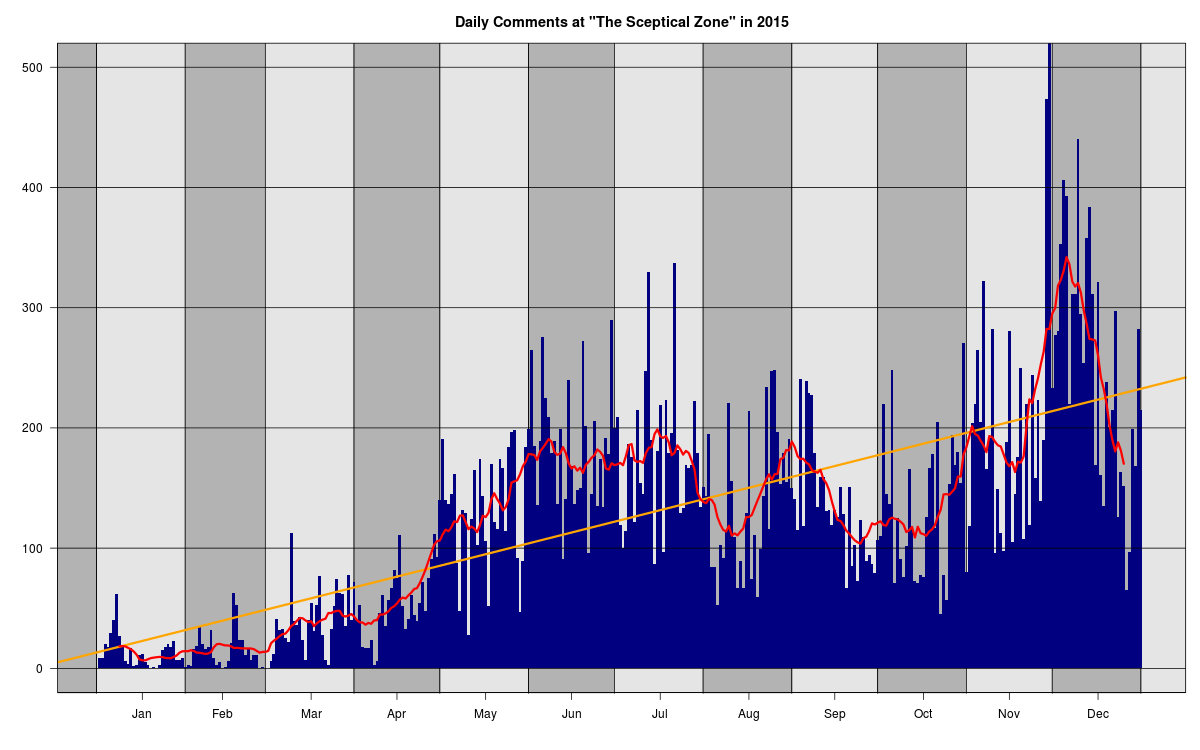
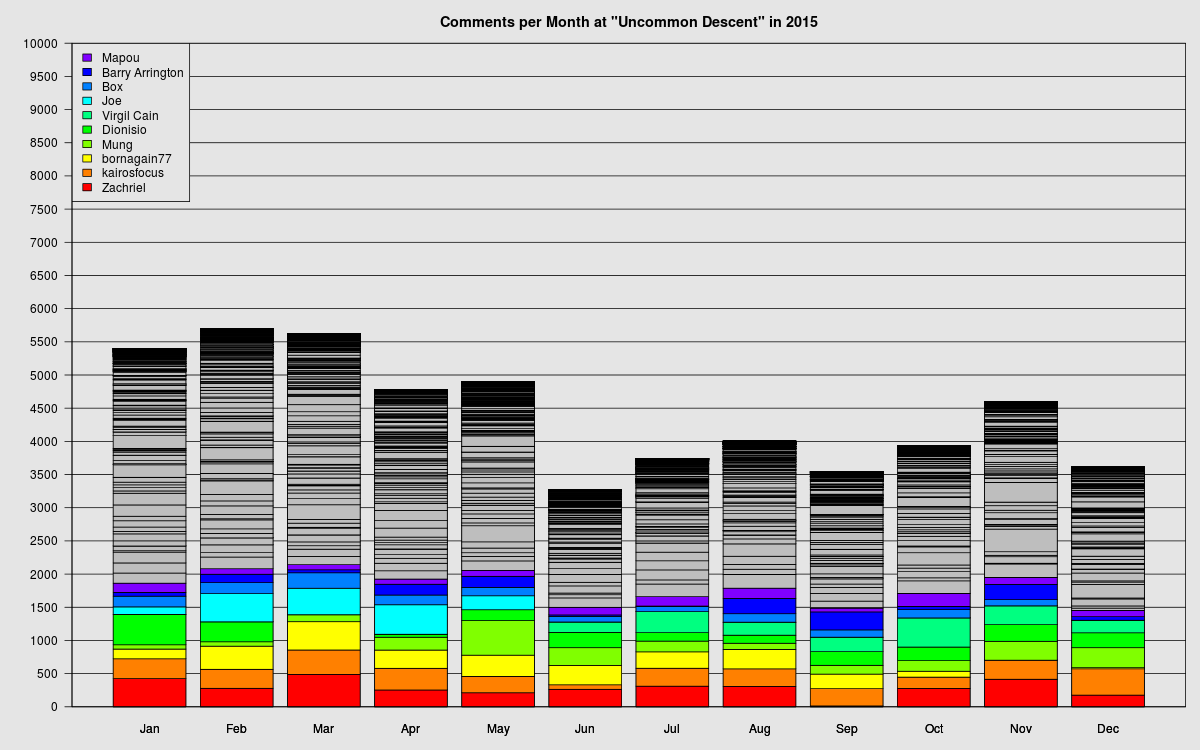
The upside trend at TSZ is much stronger, but is fuelled by the very weak participation in the first couple of months of 2015. This can be seen when comparing the number of comments on a monthly base, too:
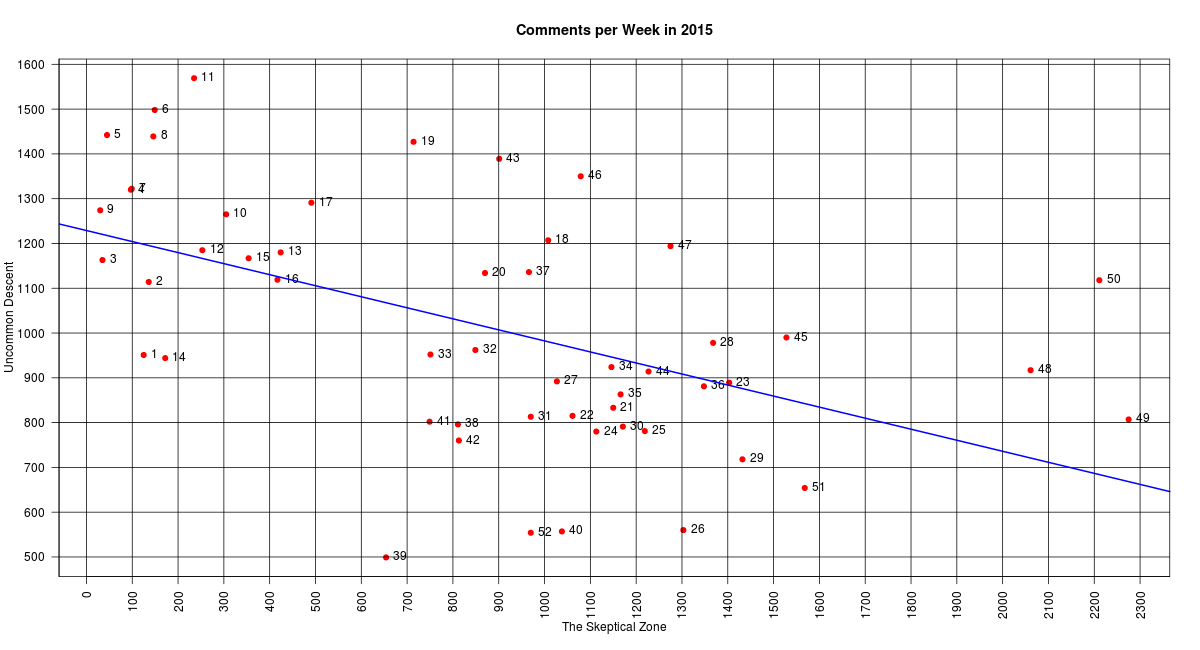
There are many ways how both sites interact with each other: the editors on both blogs may react to the same event, rising the number of comments on both sites. Or an editor, disgruntled with one site, may take his energy to the other one. Overall there is a slightly negative correlation (adj. R²=.256) between the number of comments per week:
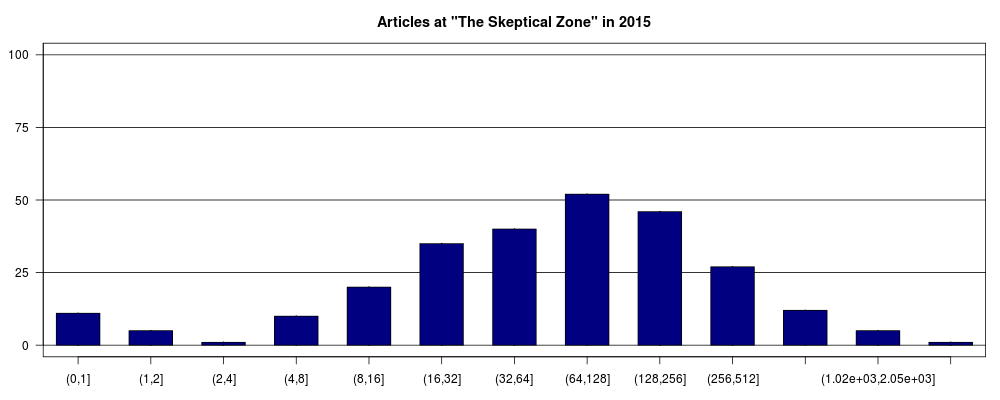
There is one big difference between both sites: the number of posts. On TSZ, there have been 265 threads with comments, while this number was 1741 at UD (there were another 200 without any comments). Therefore, the number of comments per thread is smaller at UD than at TSZ:
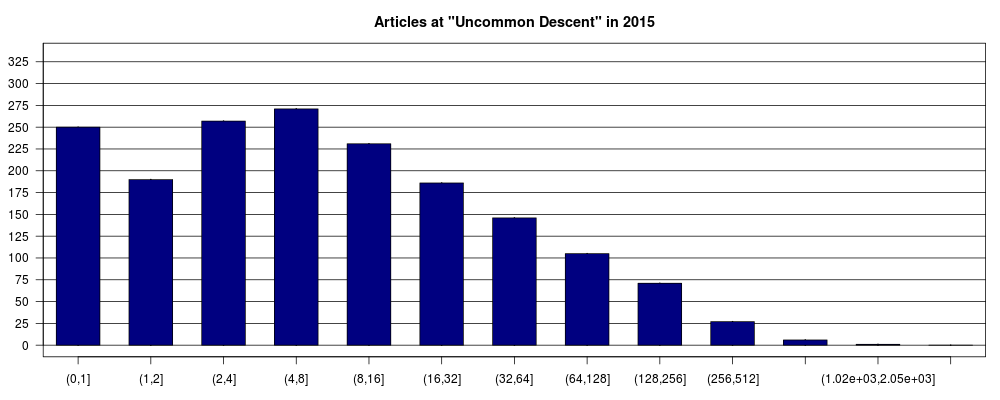
At UD, most of the posts (16% or 271 out of 1741) gathered between five and eight comments (or 1,700 – 3.2% – of the 53,100 total comments in 2015), while at TSZ, most of the threads (20% or 56 out of 265) have between 65 and 128 comments (or 5000 – 11% – of the 45,200 comments)
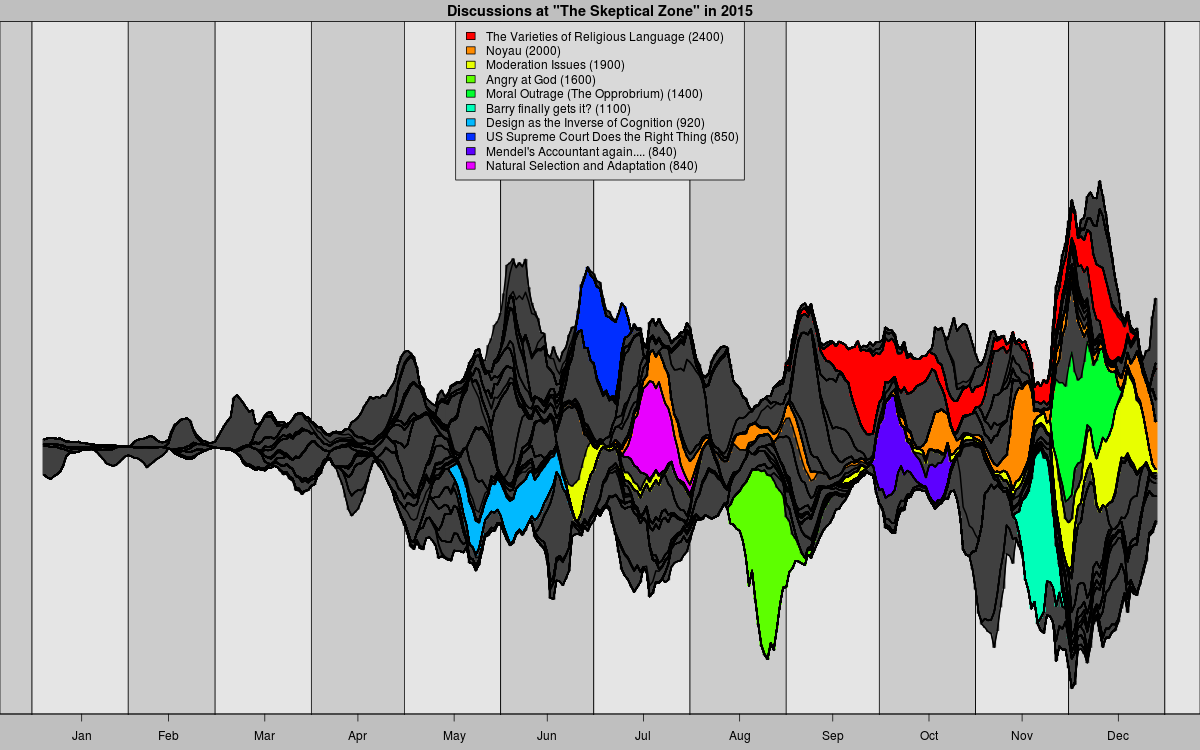
This difference is shown in this stream of comments. With the notable exception of the thread Mystery at the Heart of Life, even the busiest posts aren’t active for longer than a month at UD:
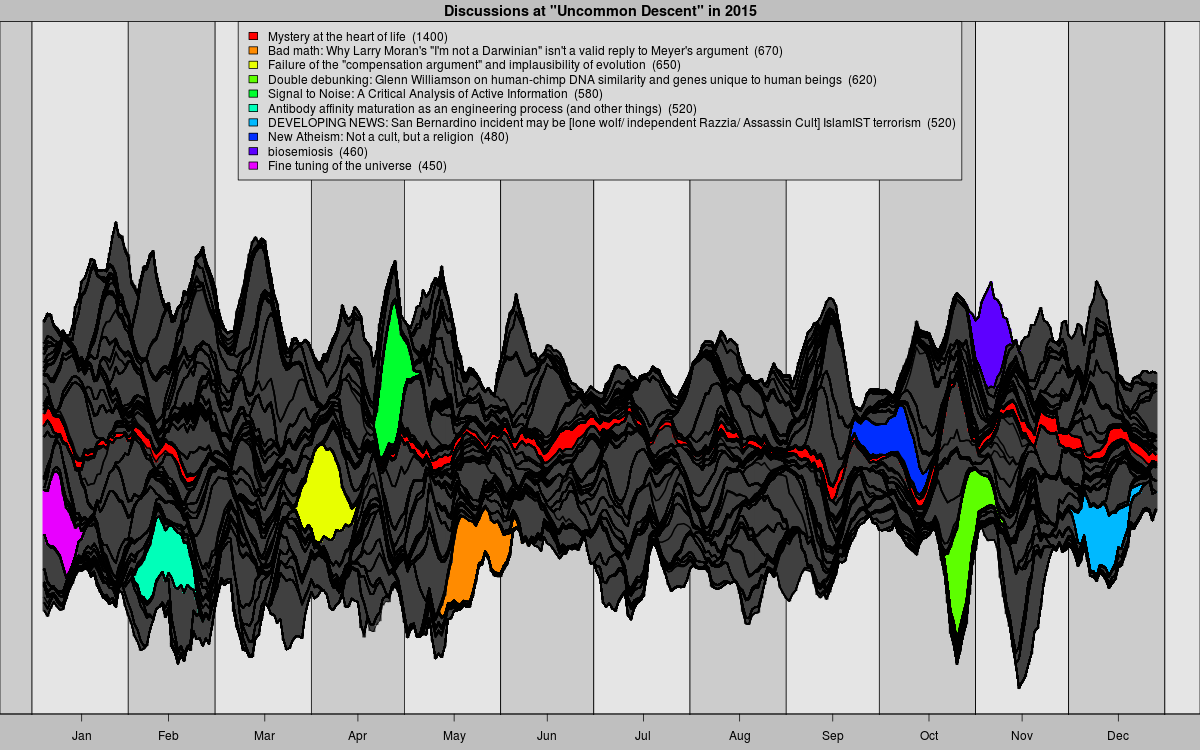
In fact, an average an article at UD will get comments over an period of 5.3 days. This average is 23.7 days for TSZ. Certainly eternal threads like Moderation Rules and Noyau play a role here, but other mainly philosophical topics are discussed over great periods of time, too.
My personal favourites of 2015 unfortunately got very few comments: Winson Ewert’s offer to Ask Dr. Ewert at UD, Tom English’s excellent reply A Question for Winston Ewert at TSZ, and then Dr. Ewert Answers, again at UD – which were commented less than eighty times in total. I had hoped for a discussion about the mathematical aspects of Intelligent Design (see my posts). Unfortunately, the design-side didn’t show any interest in anything other but an token interaction. Another chance missed.
Note: UD and TSZ both use WordPress, so they should have numerous ways to get statistics for their sites. I could look only from the outside, crawling the threads and comments. Though I’m fairly sure to got the all the visible data, I cannot guarantee to paint the real picture absolutely accurately.
Some Additional Figures

|

|
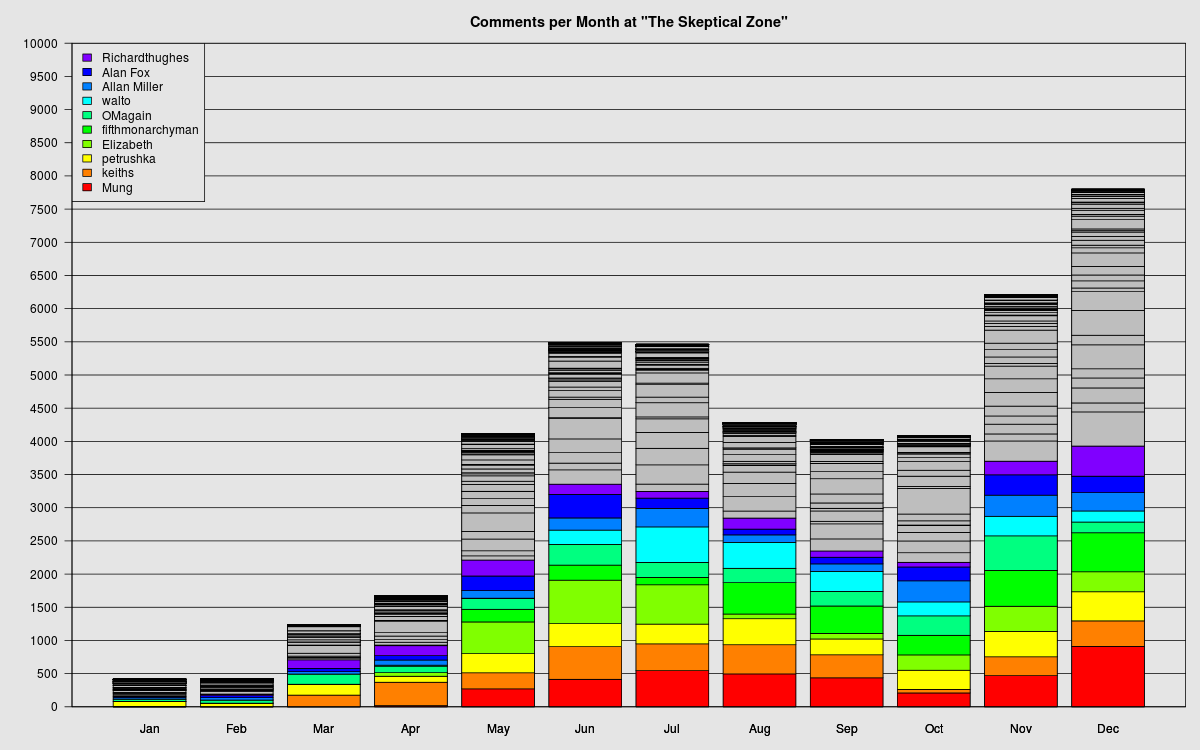
| In 2015, there some 45,000 comments were made at The Skeptical Zone. Here are the top ten of the commentators (just a quantitative, not a qualitative judgement.) I’ll stick to the color scheme for all of figures in this post… | “The Skeptical Zone” has a handy “reply to”-feature, which allows you to address a previous comments (with or without inline quotation.) It is used to various degree – and though some don’t use it at all, nearly 50% of all comments were replies. |
 |
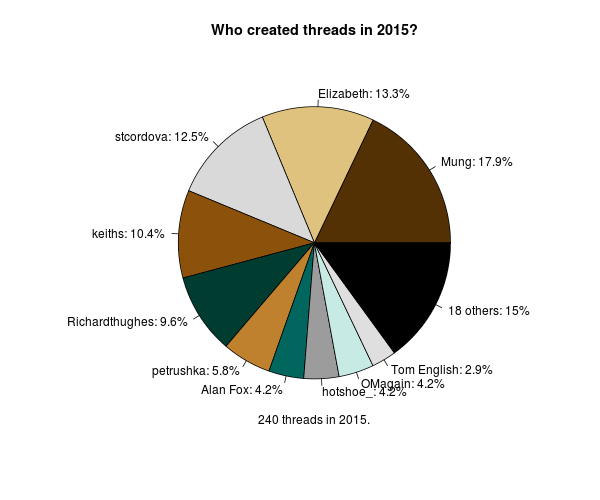 |
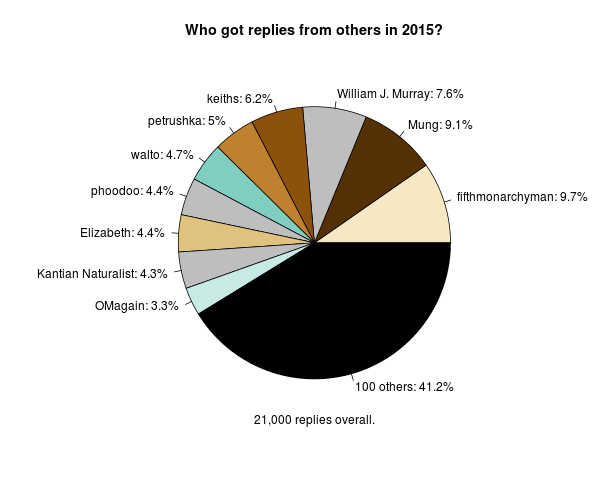
| While the previous figure showed who made replies, this one shows who receives them. | Editors at “The Skeptical Zone” are also allowed to make postings and create new threads. |
 |
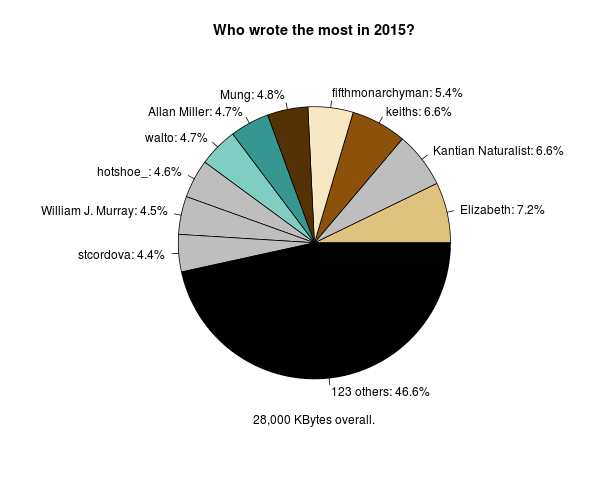 |
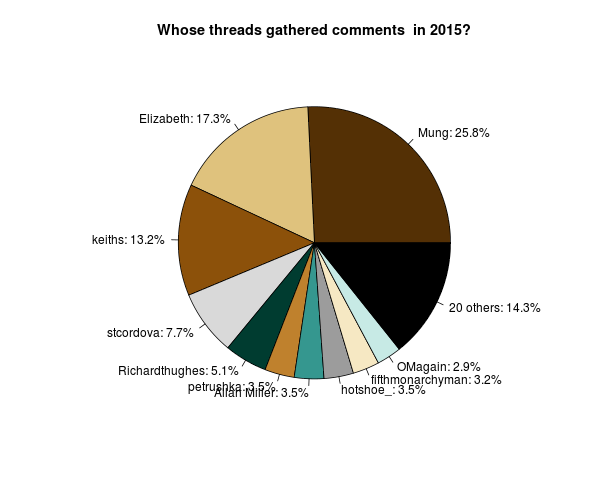
| How popular are these threads? Here the number of comments editors gathered with there threads. | Quite another question: A comment can be a short remark, a well-thought argument, or just a orgy of copying-and-pasting. How much text did the commentators write? Here is the length of the plain texts given in the comments – again, just a quantitative, not a qualitative deliberation. |
|
| A boxplot of the byte-length of comments made by the top 10 contributors. |
|
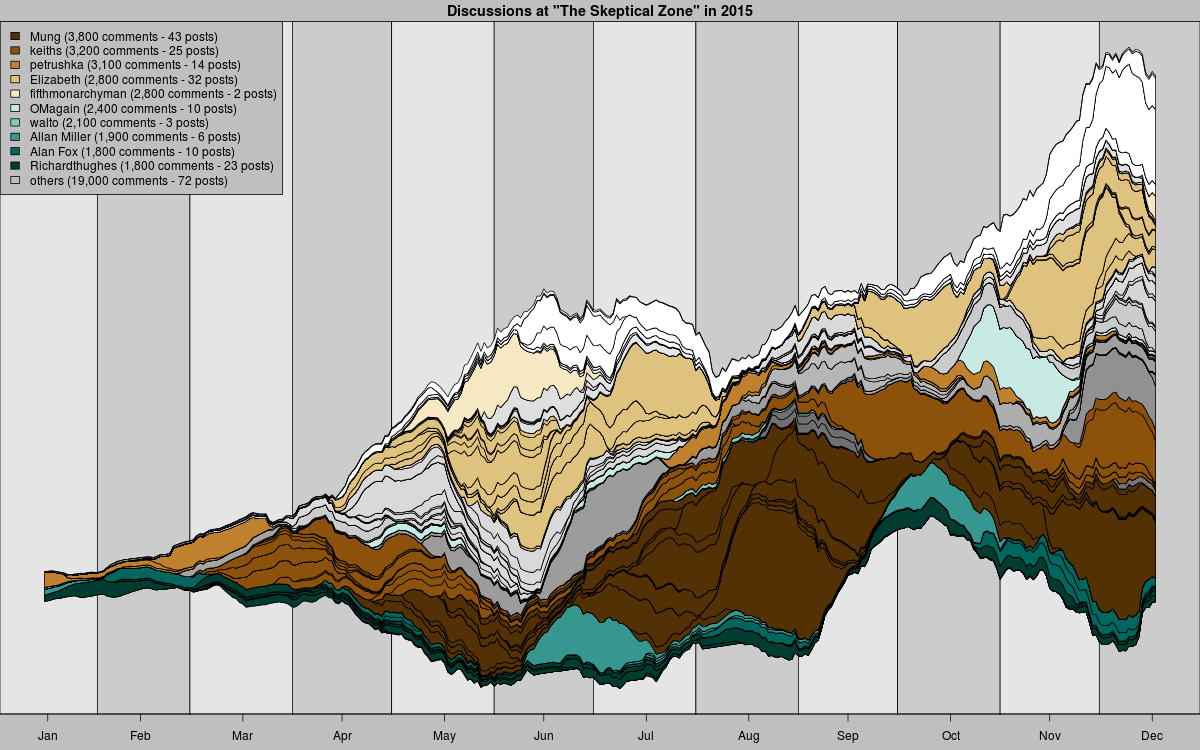
| This figure gives an impression of how many comments were attracted over time by threads sorted by the editors who had created them. |

|
| And here is the network of those who created – or received – at least 50 replies. |
TristanM,
I am weirdly inspired to comment less!
Your problem is that your posts are too interesting. No one here cares about that sort of stuff but you.
You could do like keiths and quote yourself alot. I bet he leads in that category.
Guilty. Just as long as we don’t start awarding ‘Mungies’.
What would a ‘Mungie’ look like? A pecker with no balls?